
Deploying an Azure Virtual Machine
This will be our main honeypot
This lab was inspired by Josh Madakor, whose content provided the initial idea and structure.
Azure Link
Lab Brief Summary
- Deployed an Azure Virtual Machine to act as a honeypot.
- Used PowerShell to extract Windows Event Viewer metadata, forwarding to a third-party API for geolocation data.
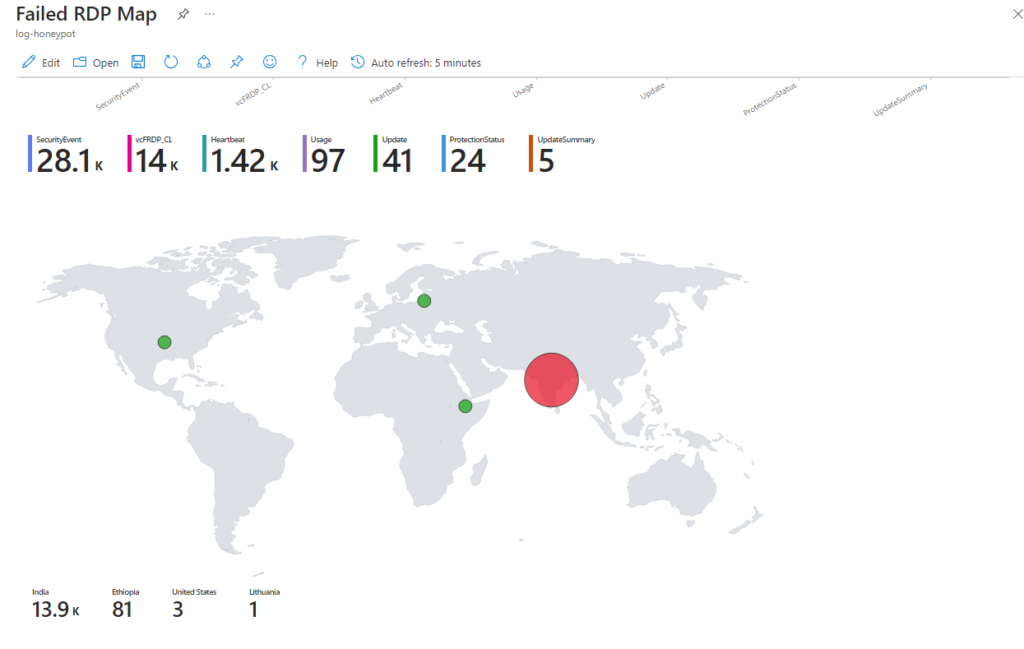
- Set up Azure Sentinel (Microsoft Cloud SIEM) workbook to visualize global attack data (RDP Brute Force) on a world map, offering insights into attack magnitudes and locations.
Additional Links
API from this site will be needed.
Script to use the API can be found below.
https://github.com/joshmadakor1/Sentinel-Lab/blob/main/Custom_Security_Log_Exporter.ps1
Azure offers a free trial that gives you $200 in credits for services. This is more than enough for this lab.
Navigate to the Azure link at the top to get started.
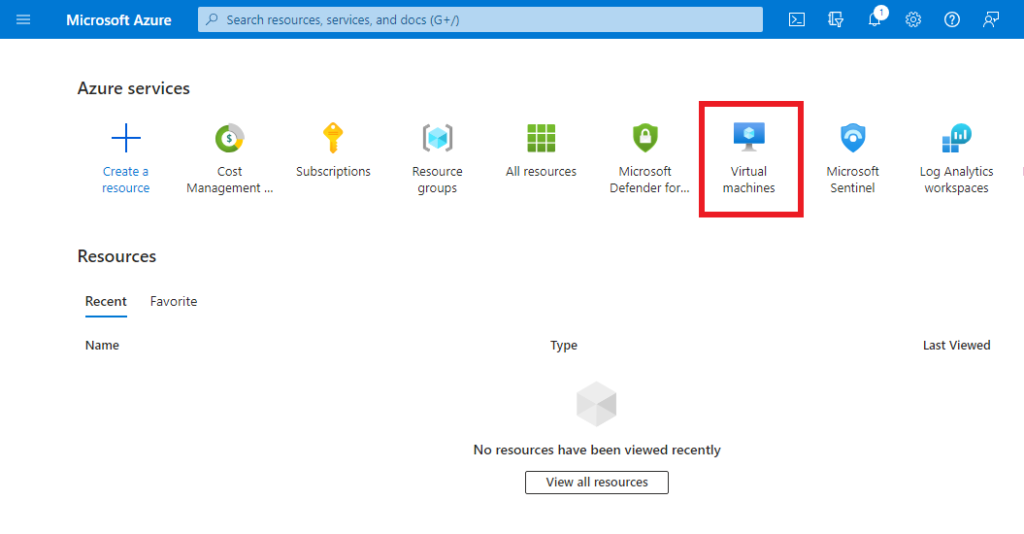
Once you have set up your profile and are ready to begin, click on virtual machines under “Azure services”. If not there, click the search bar and type “Virtual machines”.
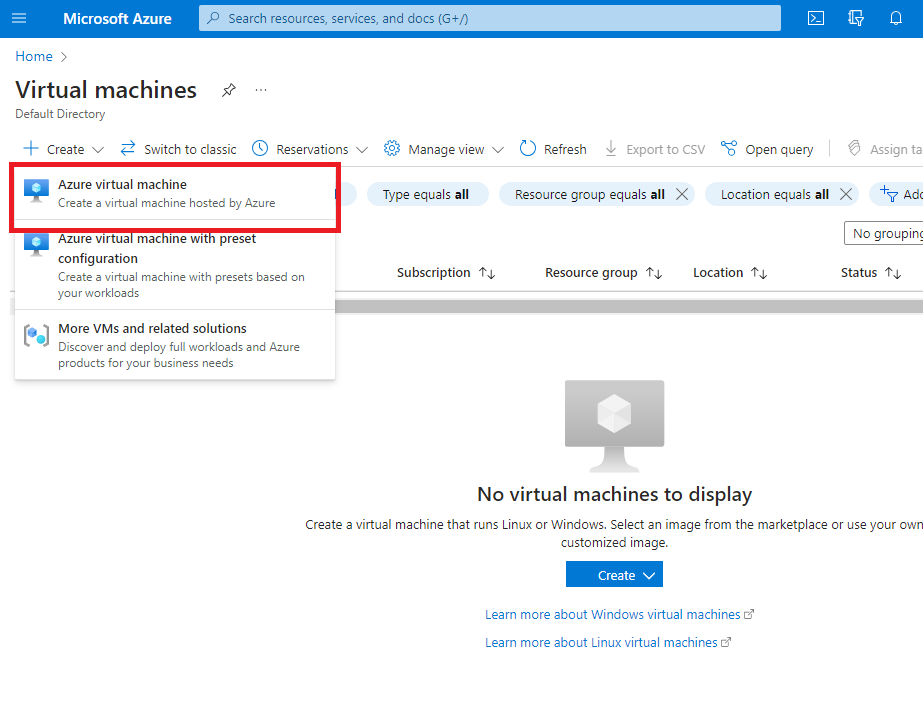
Once on the Virtual Machines page, click “Create,” then “Azure Virtual Machine.”
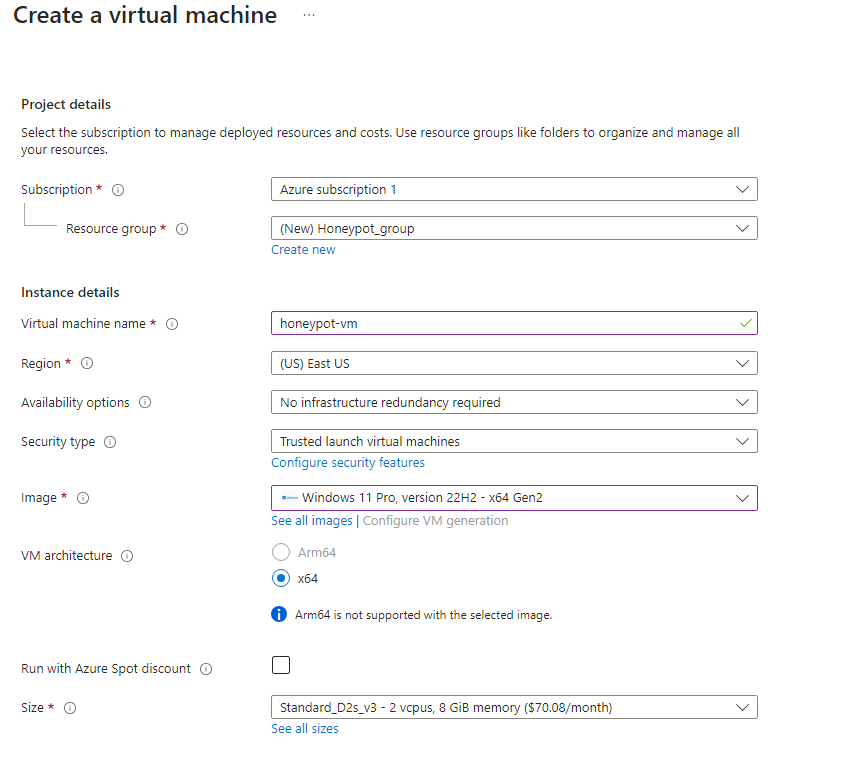
Below are the configurations I used for the virtual machine.
Resource Group: You’ll have to create a new one; just click on “Create new” and name it anything you want. I named it “Honeypot_group”.
Once the lab is complete and you have the results you wanted, delete the resource group to avoid additional charges.
Virtual Machine Name: “honeypot-vm”
You can also name the Virtual machine anything you want.
Region: (US) East US
You can pick any Region you wish.
Image: Windows 11
I left everything else as the default.
Here, I just did my first initial and last name for the username. But the password was strong. After you pick your username and password, click on “Review and Create”.
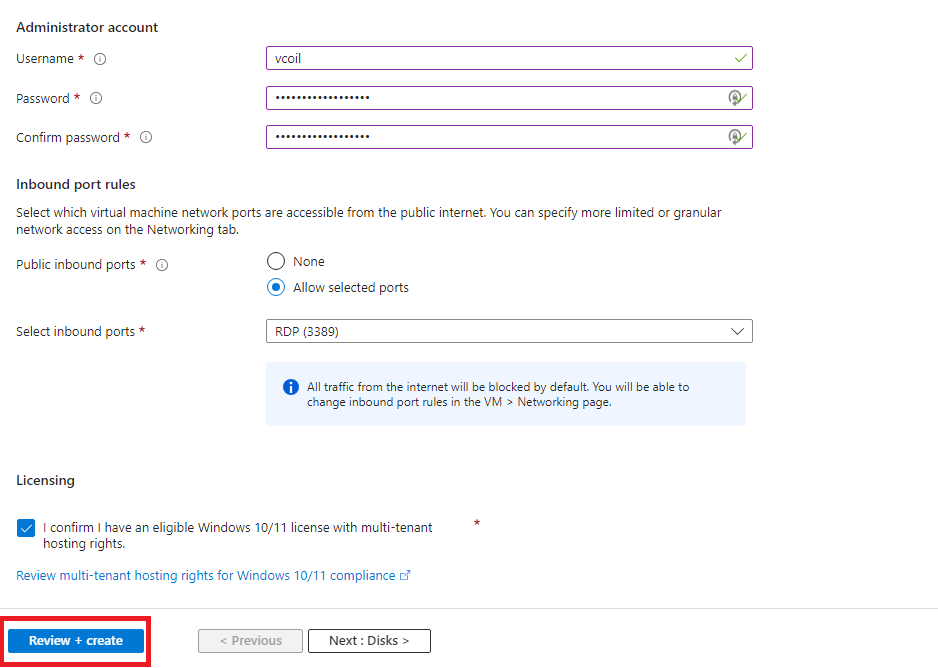
Once you see that validation passed. Click on “Create” at the bottom left.
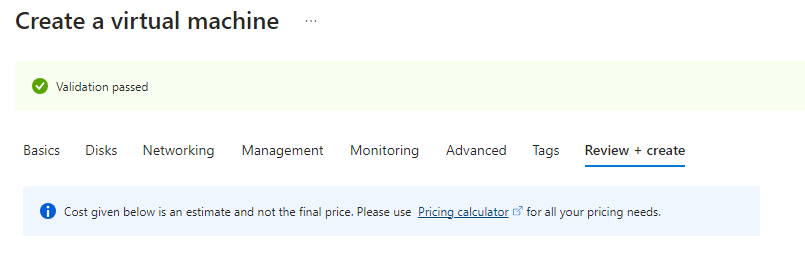
The deployment-in-progress window will appear after clicking “Create”. Just wait until it finishes; it can take a while.
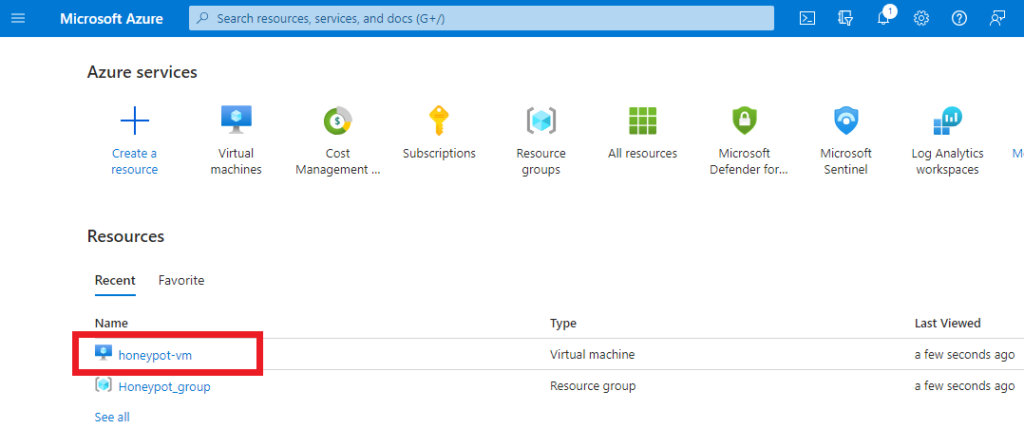
After a couple of minutes, just click on “Microsoft Azure” on the top left to go back to your main dashboard. You will find your virtual machine here.
Remember that this is a honeypot, so we need to configure network settings to make the Virtual Machine discoverable. Click on the virtual machine.
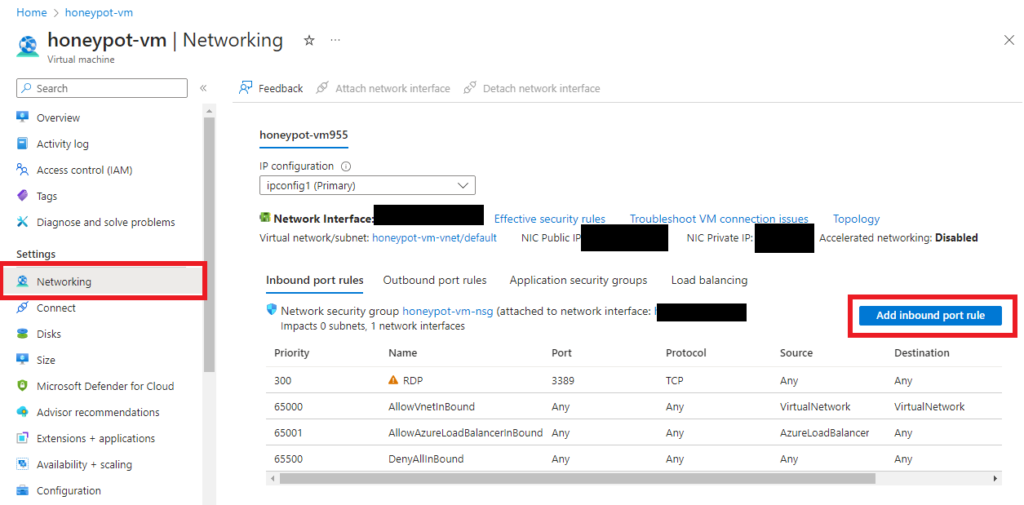
On the left-hand side, click on “Networking”. Then click on the blue “Add inbound port rule” button.
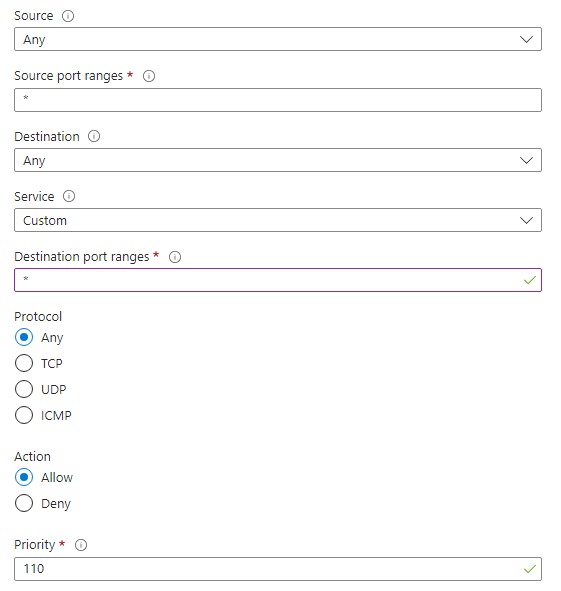
These are the configurations I did for the inbound rule. It’s to allow any and all traffic into the machine. After configuring, create/save the rule.
Log Analytics and MS Defender for Cloud
Setting up log analytics workspace and configuring Defender for cloud
Now we will set up Log Analytics and configure Microsoft Defender for Cloud
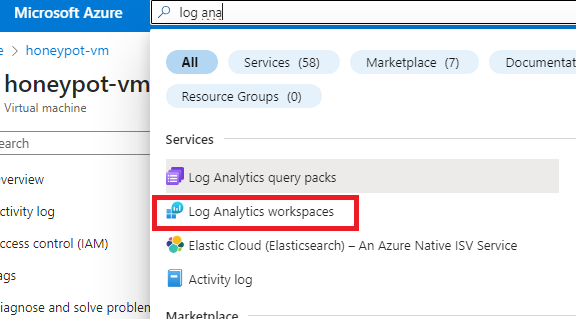
In the search bar, type “Log Analytics workspaces” and click it.
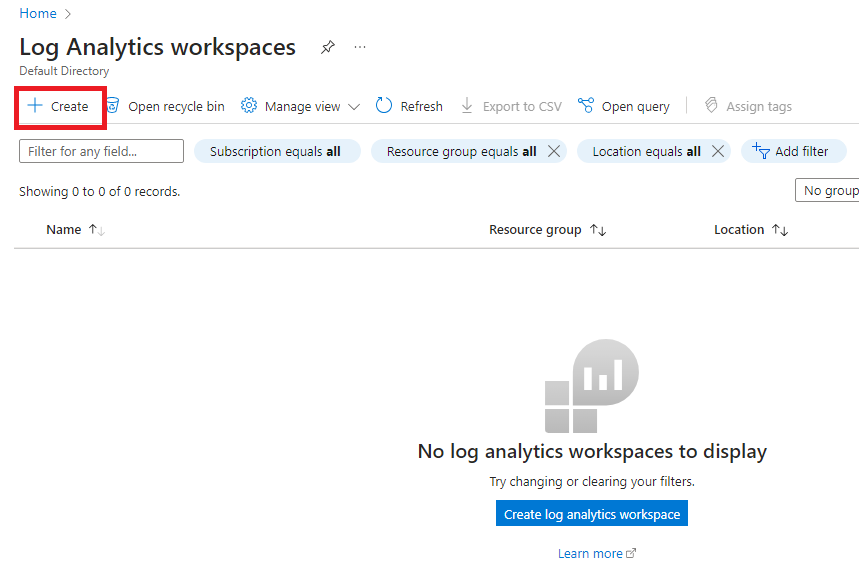
Inside the workspace, click “Create” in the top left, as shown below.
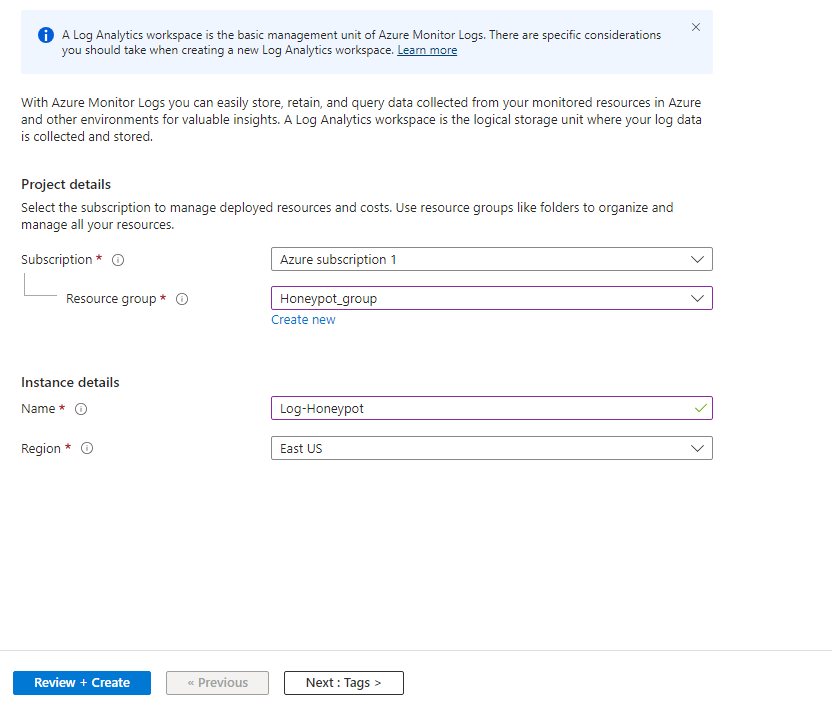
Make sure the proper Resource group is selected. Name the instance anything you want; here, I named it “Log-Honeypot”.
Click on Create and Review. Once validation is complete, click on “Create” at the bottom.
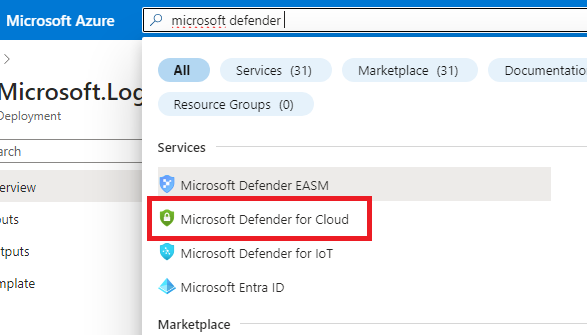
Once done with that, search and click on “Microsoft Defender for Cloud”.
On the left-hand side, scroll down until you see “Environment settings”.
Turn on Microsoft Defender for Servers for the subscription and the log-honeypot workspace.
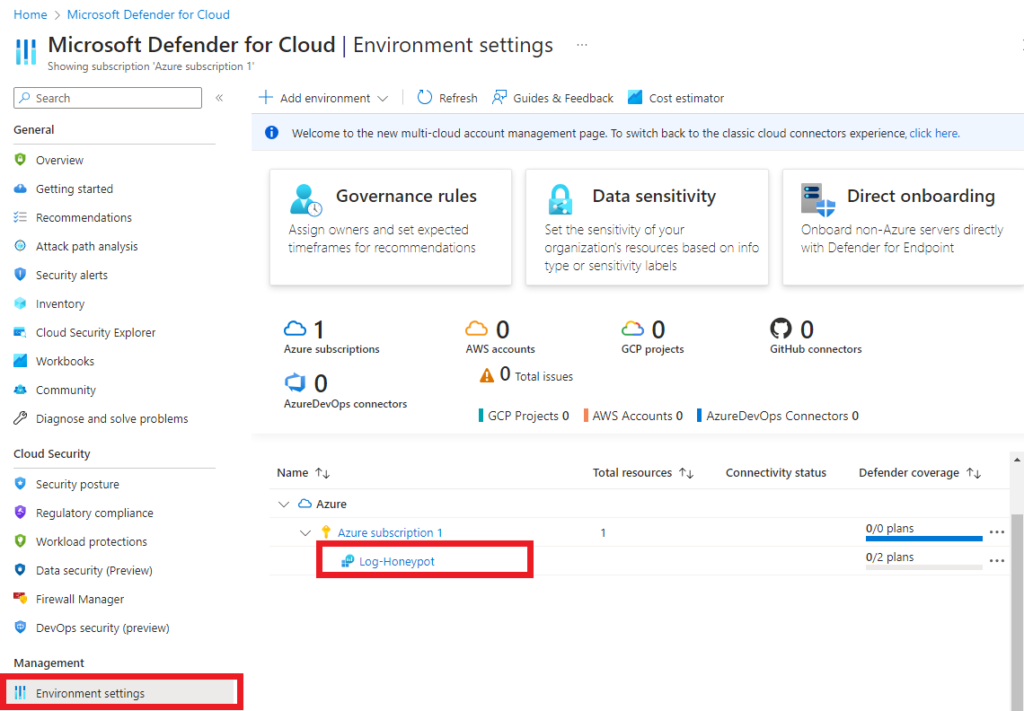
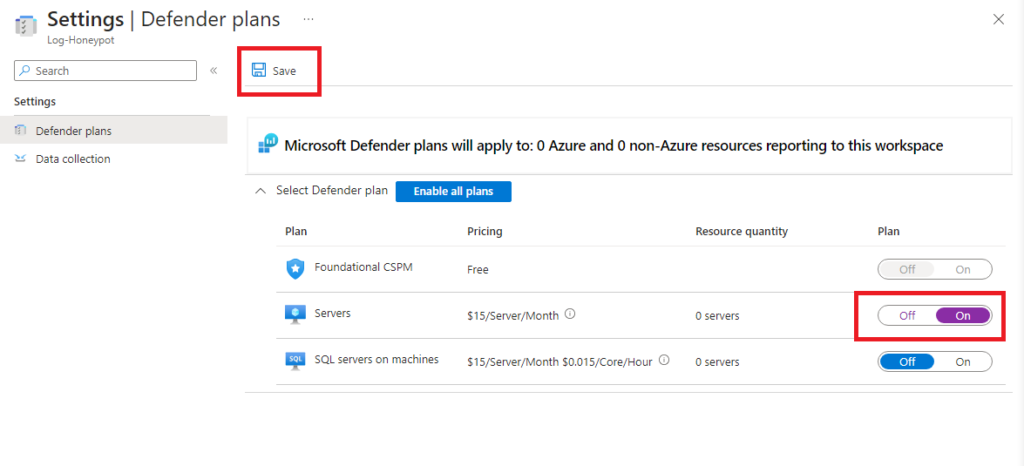
In the defender plans, turn on the Servers plan. Then save, the changes may take a bit. Make sure you do this for the “Azure subscription 1”; it could be named differently for you.
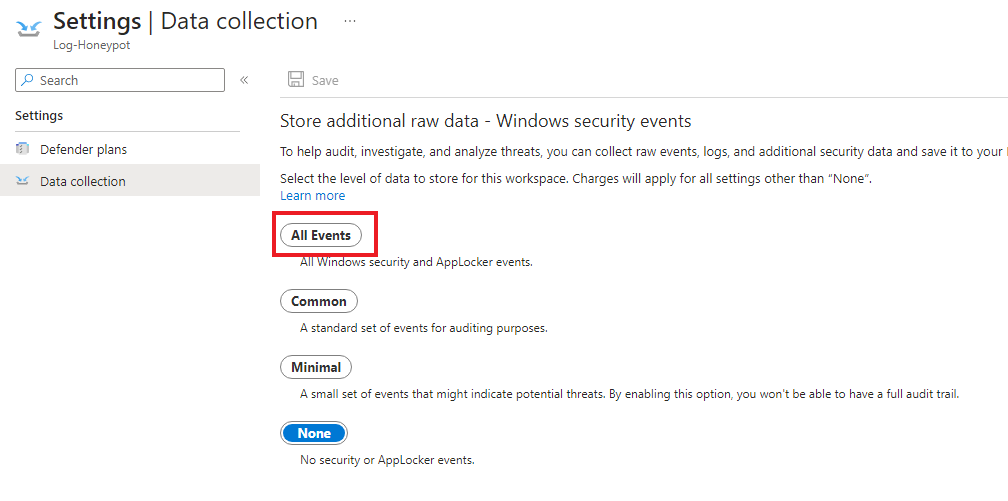
In the Data collection, click on all events, then save.
There was no data collection at the Azure subscription level, only at the workspace level.
Go back to the log analytics workspace page. Click on the Log-Honeypot workspace. Then click on the Virtual Machine.
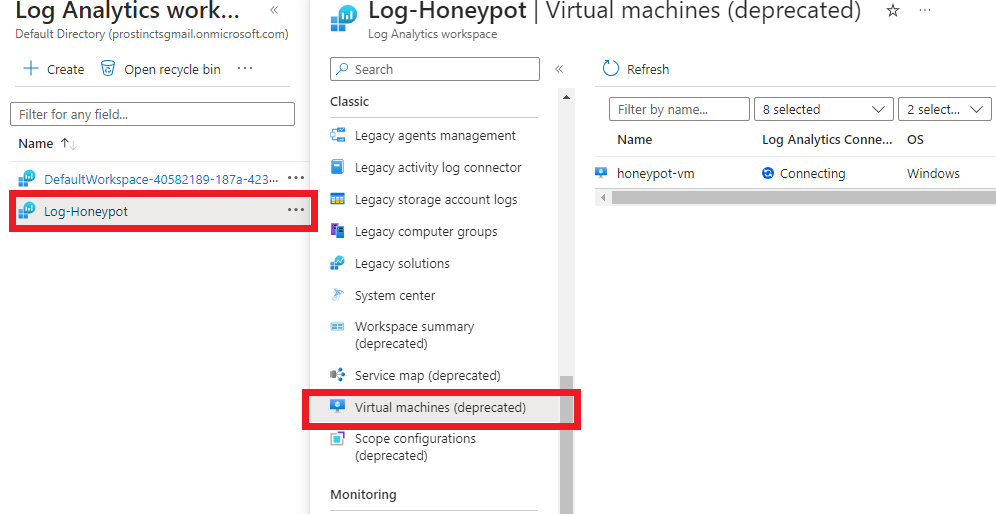
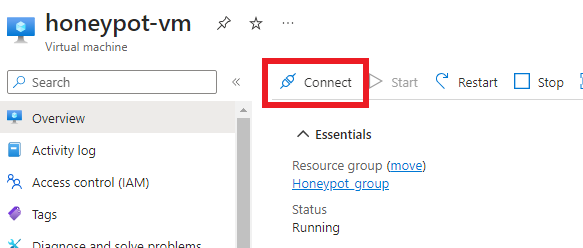
After clicking on the Virtual Machine, click on “Connect”. This allows the Virtual Machine logs to be sent to this log analytics workspace.
Navigate back to your dashboard and click on your virtual machine again. You can connect with it by clicking the connect button.
Script and VM FW Configuration
Turning off the VM Firewalls and setting up the script to collect geo-location data for any failed remote desktop connections
After clicking on the connect button, you should be able to see the IP address of the Virtual machine. We can connect to it using Remote Desktop on our actual home computer.
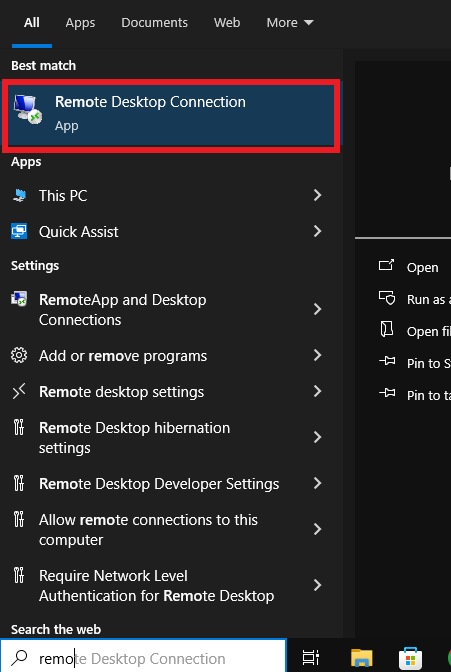
Search and click on “Remote Desktop”.
Type in the virtual machine’s IP address and use the administrator username you created when the Virtual Machine was created. Click “Connect”. It will ask you for the password.
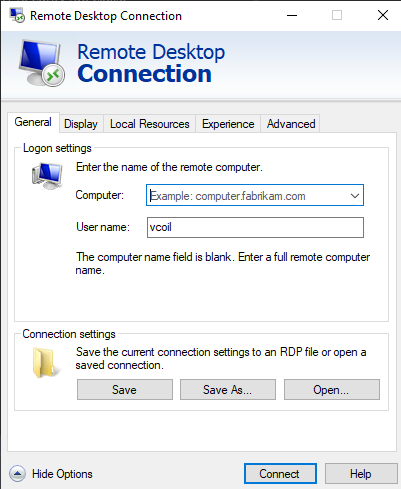
After providing the proper credentials, click “Yes” when the certificate warning appears.
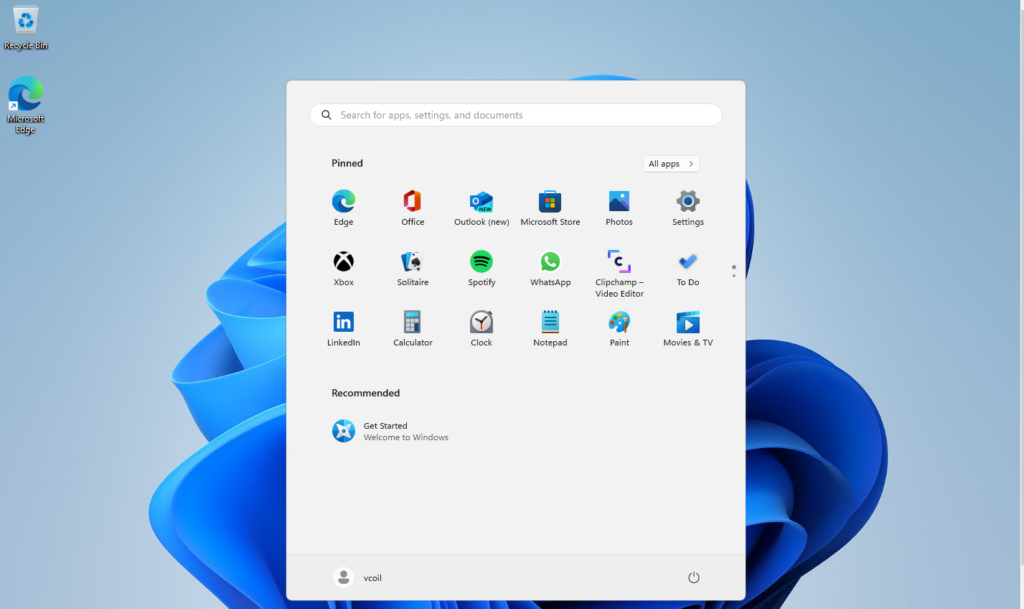
You should be connected to the virtual machine now.
Inside the virtual machine, go to this GitHub and download the script. There will be a “Download raw file” button on the top right of GitHub.
https://github.com/joshmadakor1/Sentinel-Lab/blob/main/Custom_Security_Log_Exporter.ps1
I also created an account on the website below, as the website’s API will be used with the script.
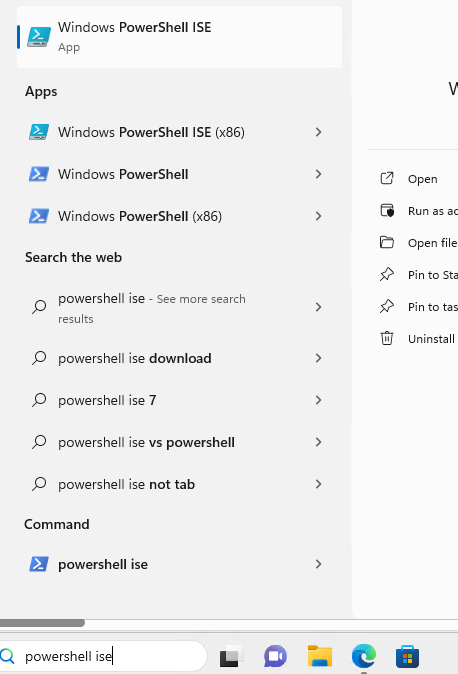
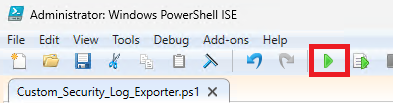
In the virtual machine, search for “PowerShell ISE.”
In PowerShell, click on “File > Open”. Then navigate to where the script was downloaded. For me, it was in the “Downloads” Folder.
Replace the API Key with your API key. (That isn’t my API key. Please don’t store API keys in public places.)
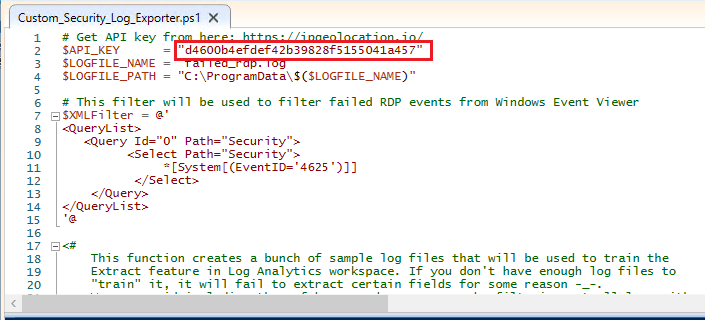
Once you replace the API. Save by clicking on CTRL+S.
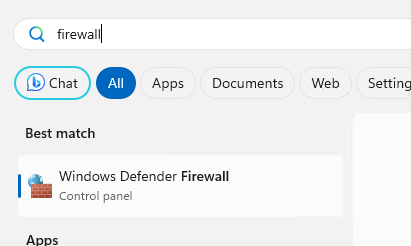
The script is ready. But one last step, we need to turn off the firewalls on the VM. On the virtual machine, search for “Firewall” and click on “Windows Defender Firewall”.
With Windows Defender Firewall open, click on “Advanced Settings”.
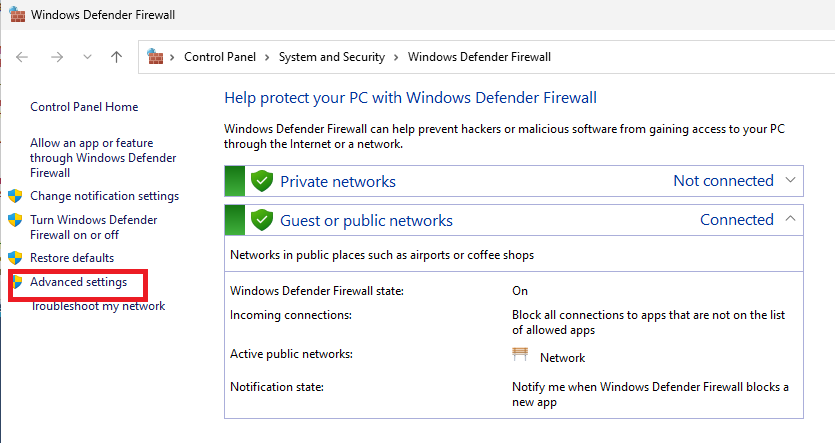
Then click on “Windows Defender Firewall Properties”. (Last check, please make sure this is on the Virtual Machine and not your real computer)
On all 3 profiles, turn off the Firewall state.
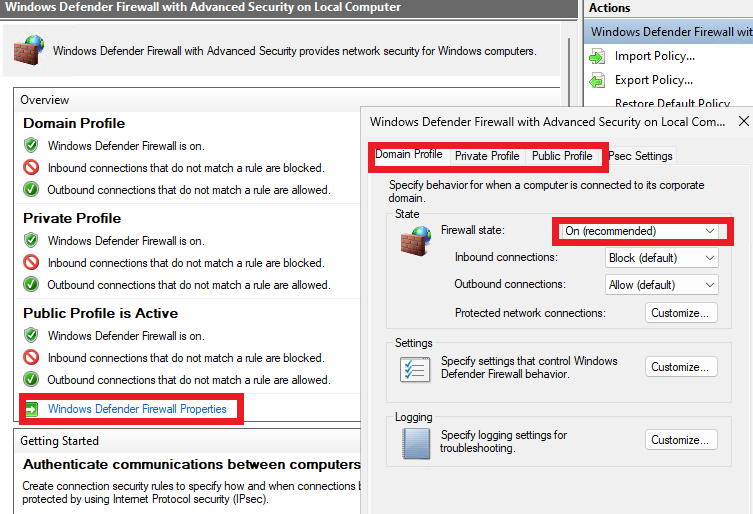
With all three profiles off now, close out from the firewall windows. Then run the script using the green arrow in PowerShell.
You can try pinging the virtual machine from your real PC. If it pings successfully, then everything works, and it can be found by other computers. It’s just a matter of waiting for the threat actors.
If the ping fails, make sure you look that all 3 profiles are off. Look over the Virtual machine’s network settings and make sure the configurations are right.
It may take a while to see attempted brute-force attacks. (It took me 4 hours)
Creating a Custom Log
Creating a Custom log to parse for geo data
Let’s now make a custom log for our Sentinel Workbook.
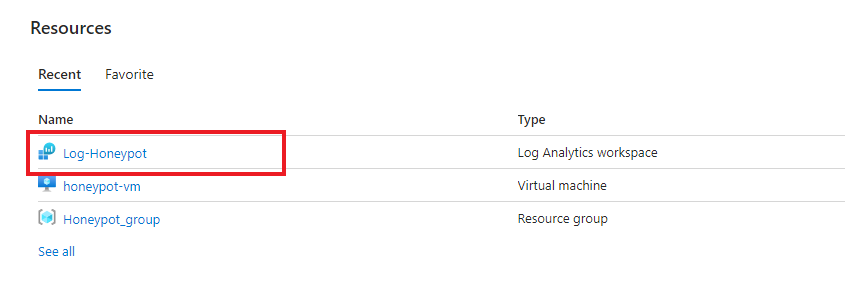
Back to the Azure dashboard, click on your log analytics workspace
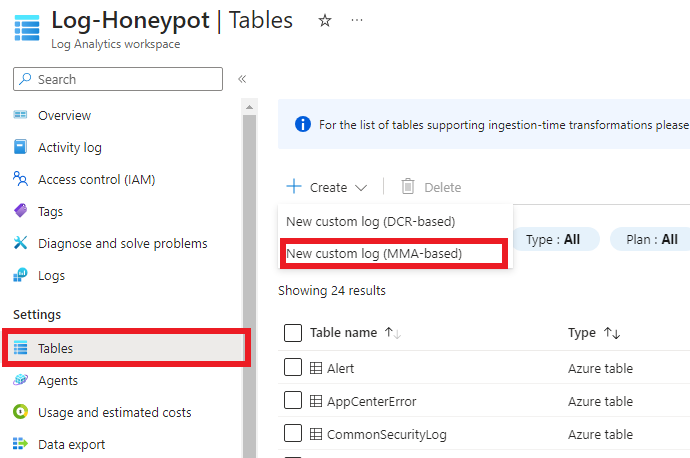
Click on “Tables” on the left side, then click on “Create”. Then “New Custom log (MMA-based)”
In the Virtual Machine, navigate to the file shown below.
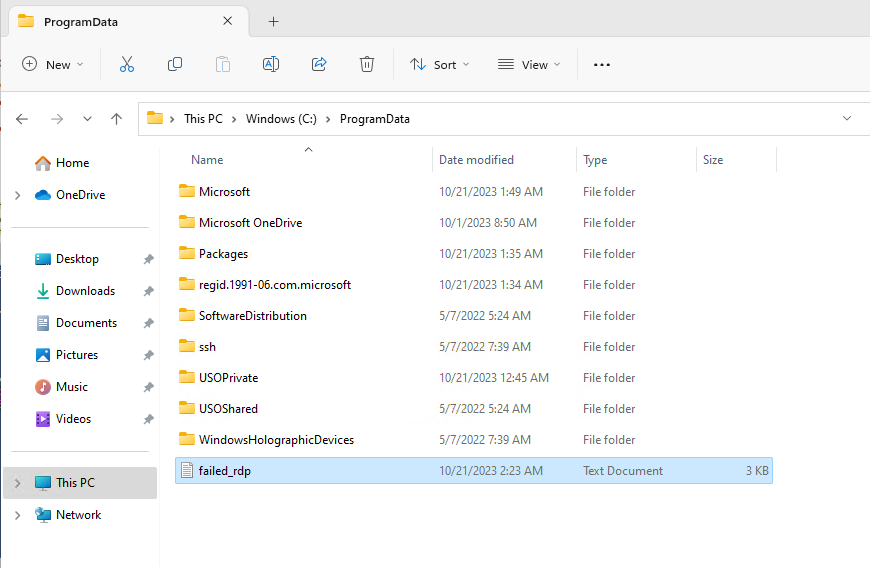
Open the file, and copy the entire file.
On your ACTUAL machine, just create a .txt file on your desktop and paste the logs into it. The virtual machine and your machine are sharing the clipboard.
I named mine “FailedRDPSample.txt”
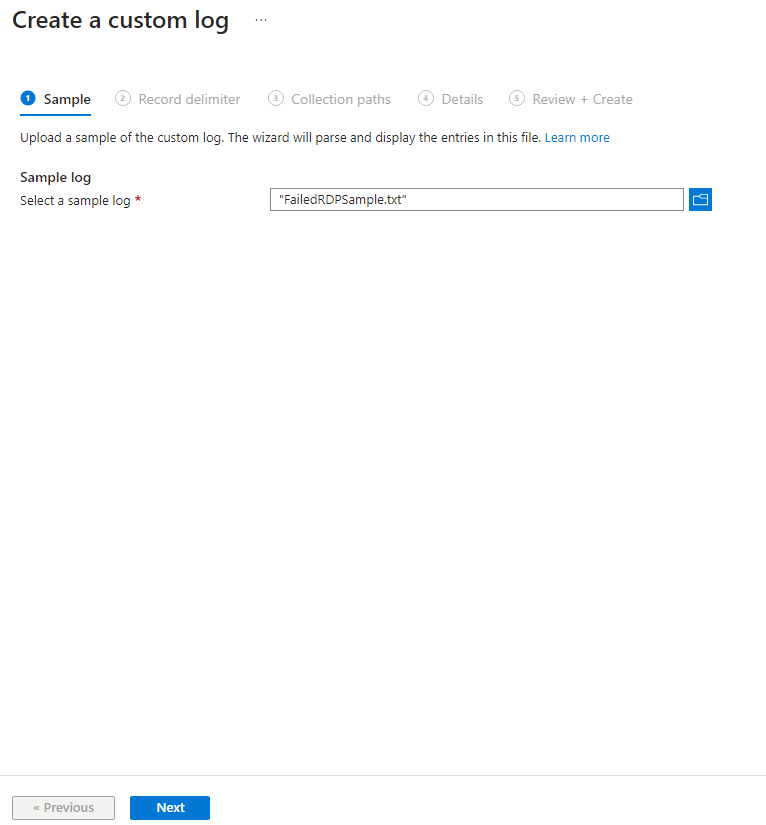
Select the file, then click Next.
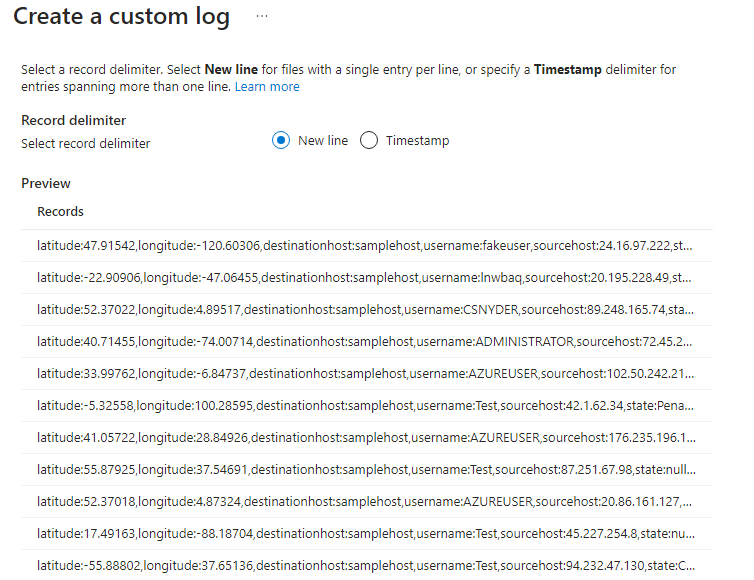
For the “Record delimiter”, click next if the logs seem fine.
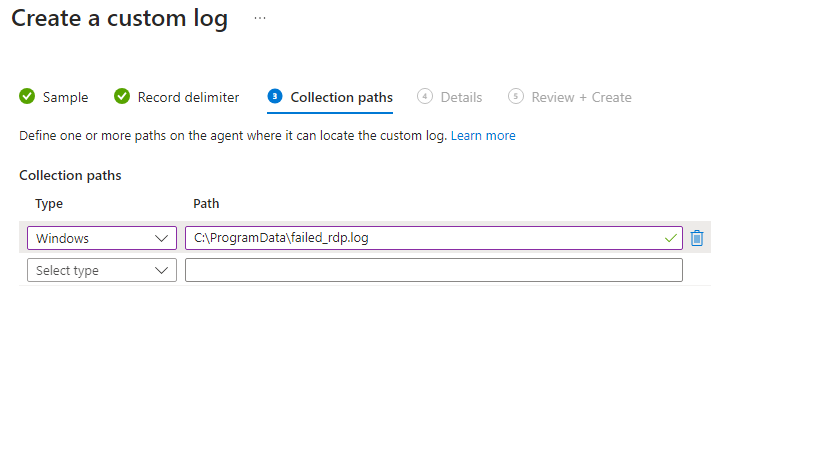
For the “Collection Path”, put the path of where the “failed_rdp.log” file is located INSIDE of the Virtual Machine. For me, it was “C:\ProgramData\failed_rdp.log”
Pick a name for the custom log then click next.
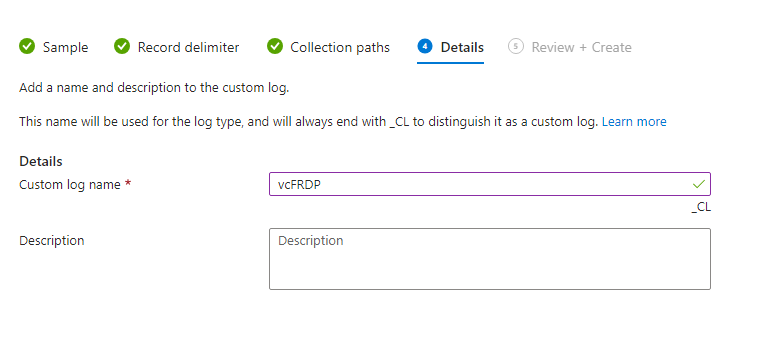
After that, review and then click on Create.
You will have to wait a little while for the logs to sync.
You can go to the logs on the left-hand side and try to query the table you made or the security event, as shown below.
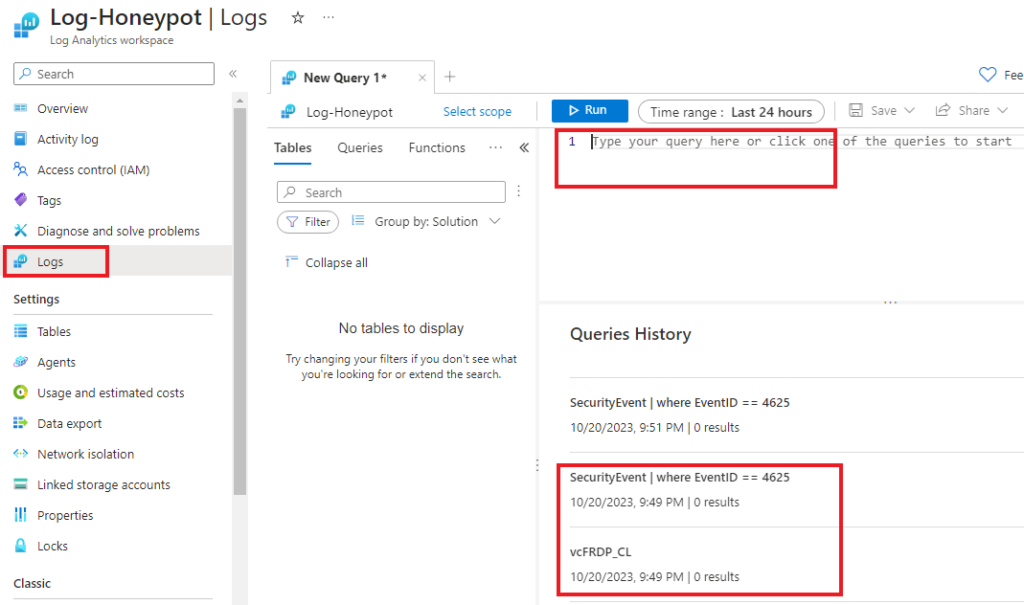
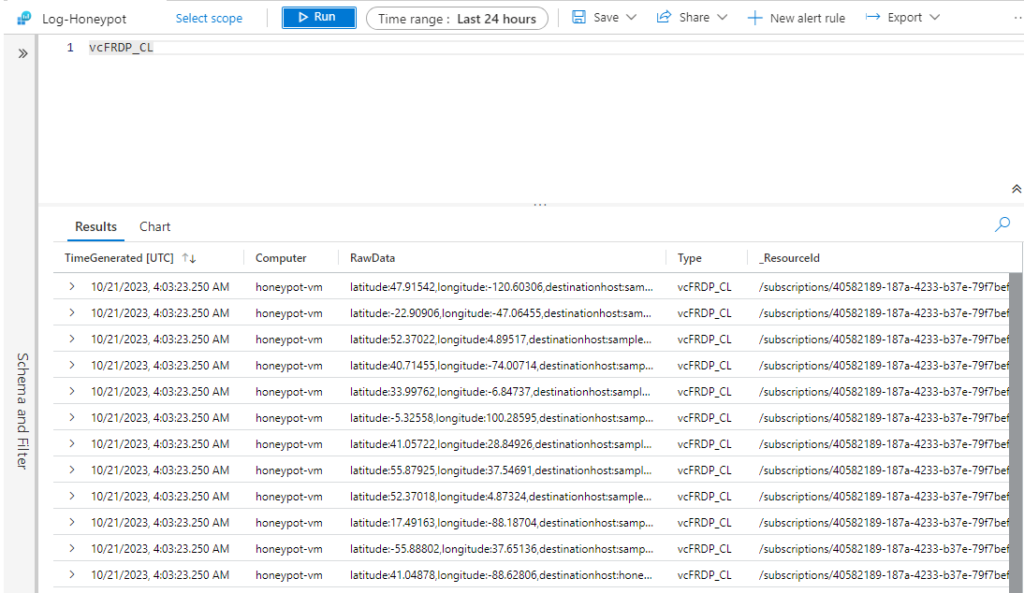
Below is when the logs start to appear.
Sentinel Workbook
Setting up the workbook to visualize the logs
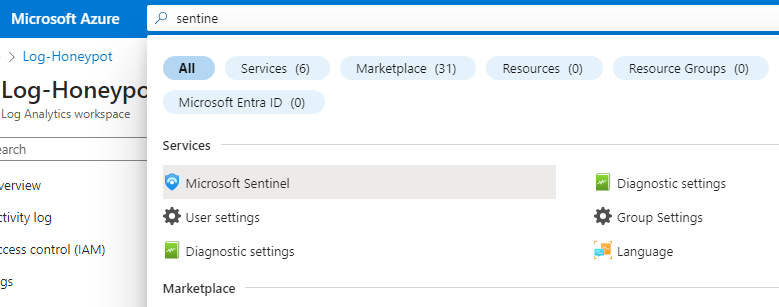
Now, let us set up Sentinel and create a workbook within it. Search and click on “Microsoft Sentinel”.
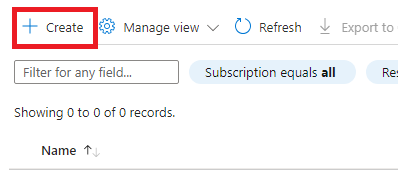
Then click on “Create”.
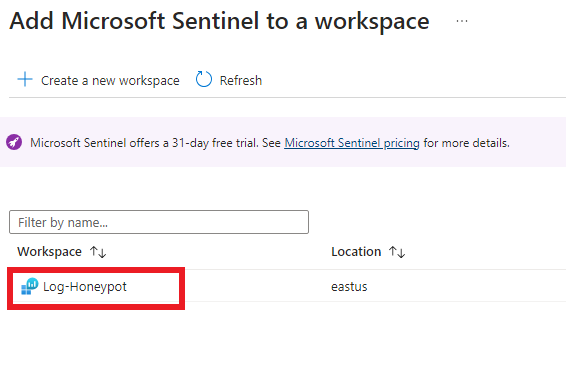
Your Log Workspace should already be there; click on it.
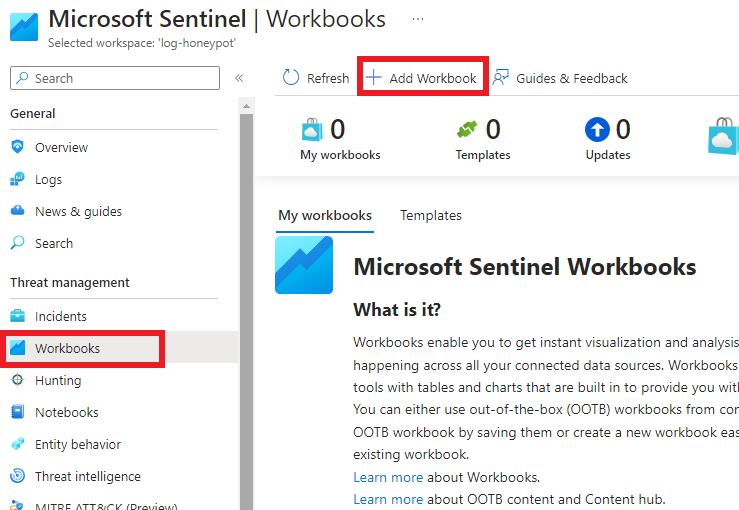
On the left-hand side, click on “Workbooks”. Then, at the top, click on “Add Workbook”.
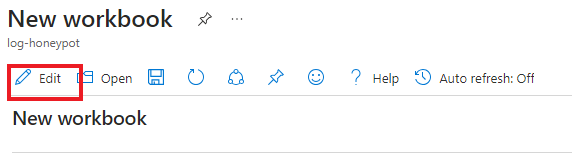
Inside of the newly created workbook, click on “Edit” on the top left.
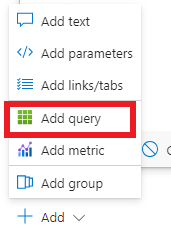
Scroll to the bottom and click on “Add”. Then “Add query”.
This is the query I used.
vcFRDP_CL

| extend username = extract(@"username:([^,]+)", 1, RawData),

         timestamp = extract(@"timestamp:([^,]+)", 1, RawData),

         latitude = extract(@"latitude:([^,]+)", 1, RawData),

         longitude = extract(@"longitude:([^,]+)", 1, RawData),

         sourcehost = extract(@"sourcehost:([^,]+)", 1, RawData),

         state = extract(@"state:([^,]+)", 1, RawData),

         label = extract(@"label:([^,]+)", 1, RawData),

         destination = extract(@"destinationhost:([^,]+)", 1, RawData),

         country = extract(@"country:([^,]+)", 1, RawData)

| where destination != "samplehost"

| where sourcehost != ""

| summarize event_count=count() by latitude, longitude, sourcehost, label, destination, country
Run the query, and for “Virtualization”, click on the map, and change the size to full.
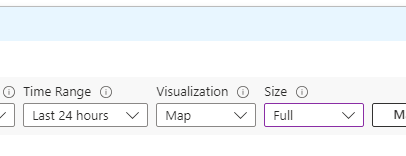
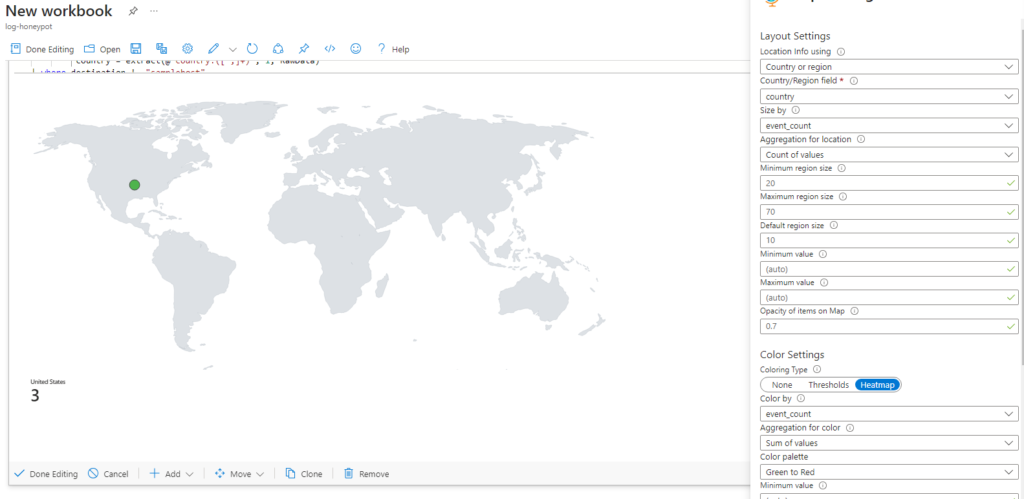
Below are some of the configurations I changed. Everything else was kept as the default.
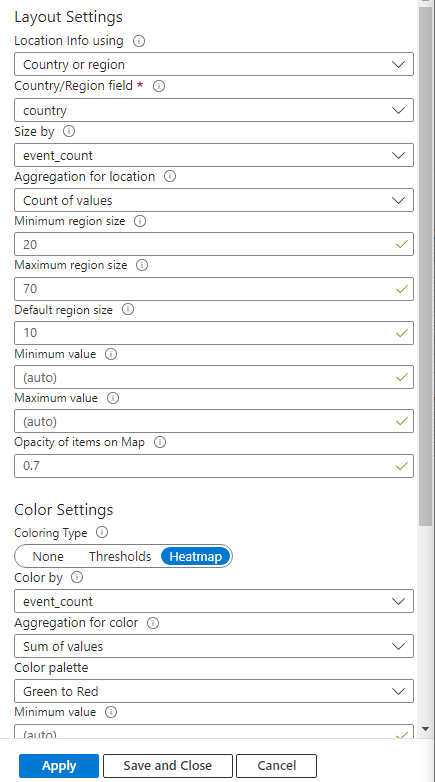
Click on “Apply”, and “Save and Close” once done. On the top left, click on “Done Editing”.
That’s it! Now just wait for the results.
Below are the results after leaving the virtual machine on for 24 hours. Close to 14 thousand failed attempts.
I also set up a table below the map to see what username the threat actor tried to log in with. As well as the IP Address.
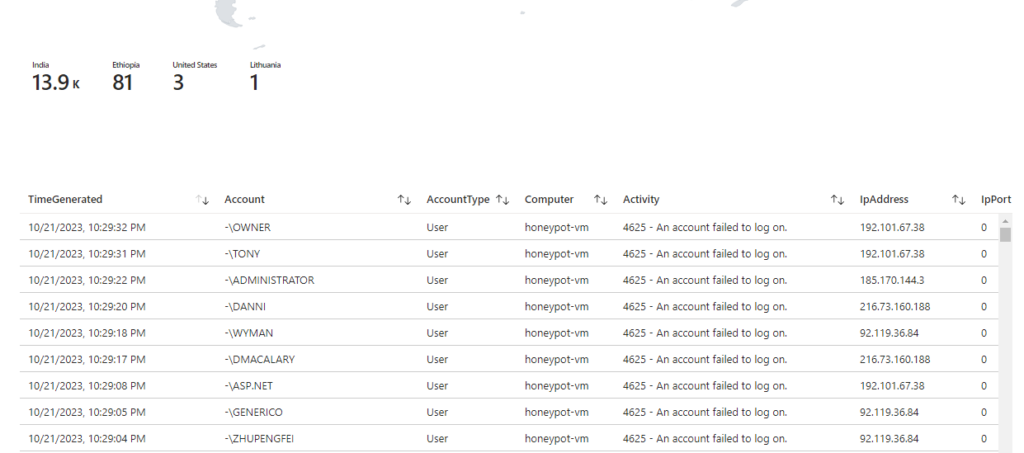
This is where IP Blocks can begin to be coordinated.
Again, I only had this virtual machine up for 24 hours. If I were to keep it up longer, there is no doubt in my mind that there would be many more attempts from other countries beyond the 4 listed on the map.
This lab shows that as soon as a machine goes online, it begins to be enumerated and attacked.
As well as the importance of not having basic passwords and user accounts.
This concludes the lab.