
Splunk Deployment
Deploying Splunk Enterprise
Prerequisite Labs
Lab Brief Summary
This lab will cover the deployment of Splunk Enterprise and Universal Forwarders onto an Active Directory Environment for Centralized Logging. Enhanced logging will be done using Sysmon. As well as the deployment, Configuration, and integration of the IDS tool Snort into Splunk.
Splunk Free Trial Download
To get started, we need to download Splunk Enterprise and the Universal Forwarder.
We can open our browser inside Client1, search for “Splunk,” or copy the download link above and paste it into your VM, then click Downloads.
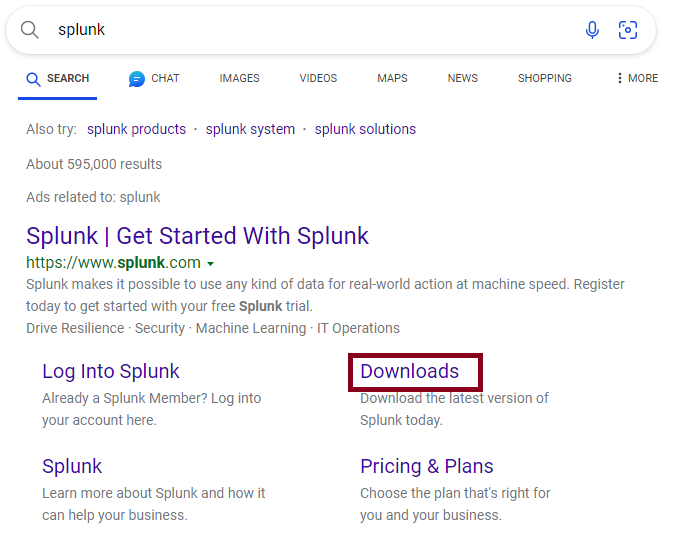
We will be deploying Splunk Enterprise on Client1. Client1 will be where our logs will be centralized. Click on “Get My Free Trial”.
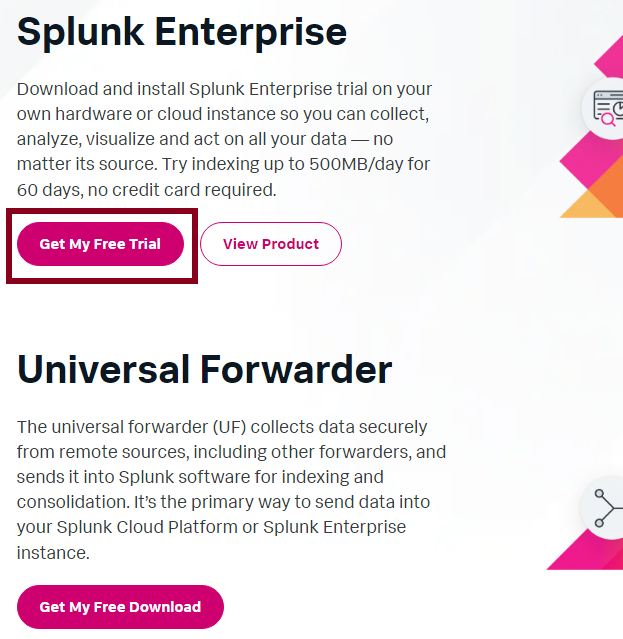
After clicking the button, fill in the information, then click the button to create an account and move on.
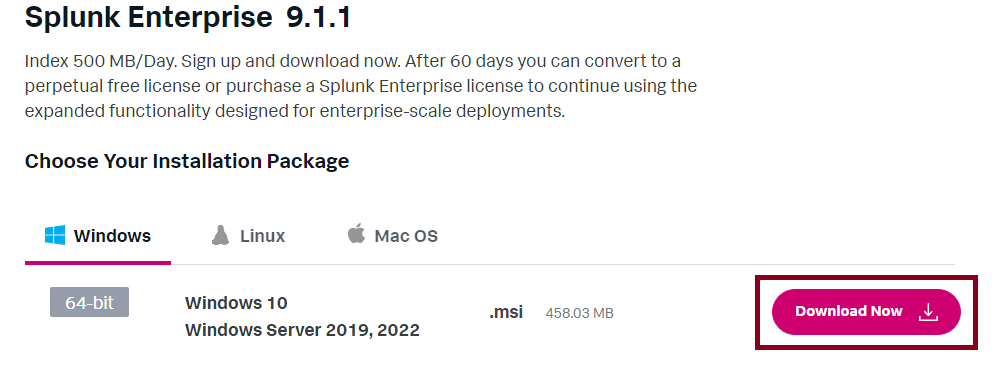
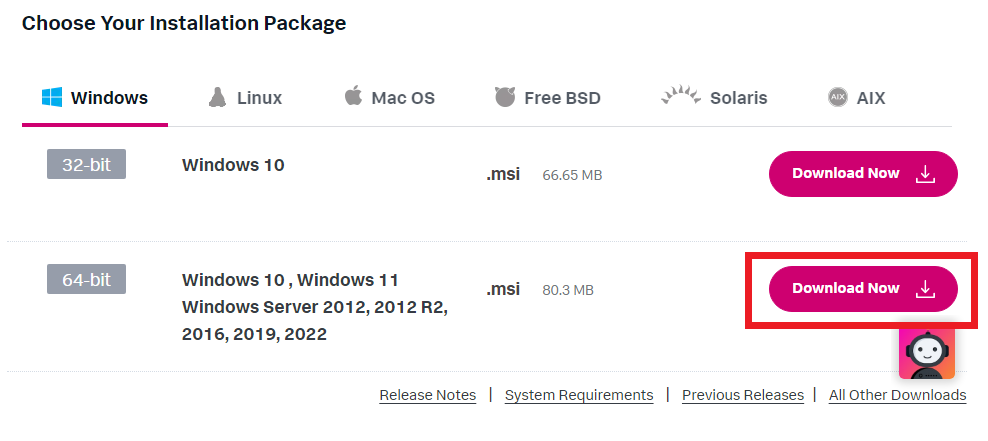
Then, for this case, we’re using Windows 10, so just click on Download Now on the 64-bit Windows version.
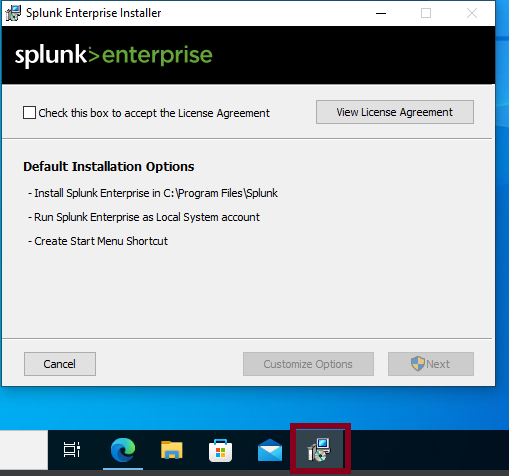
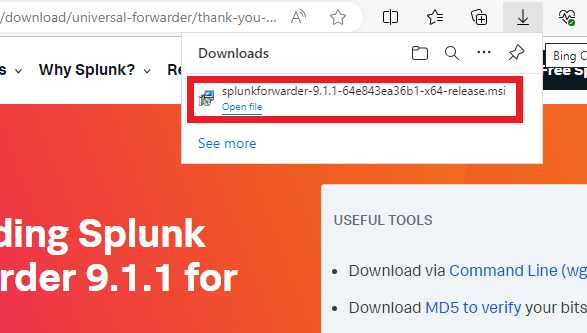
Once downloaded, the installer will open up automatically. The Browser window might get in the way, so keep an eye on the taskbar.
Accept the License Agreement on the installer box and click Next.
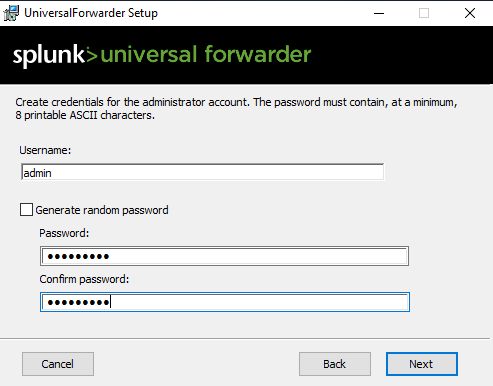
After hitting next, you’ll be asked to create some credentials for the Splunk administrator account. For this lab, I’ll use credentials that are easy to remember.
After that, click next, then click install.
If the User Account Control panel pops up, enter a Domain Administrator’s credentials to allow changes.
After giving it some time, Splunk Enterprise should be successfully installed. Click on “finish” on the Setup window.
You can access the Splunk Web interface using
Or
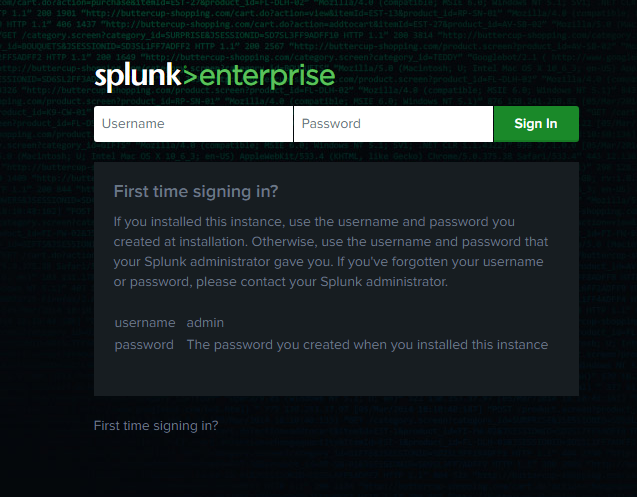
Then you’ll be greeted with the login page. Use the credentials you created during the setup.
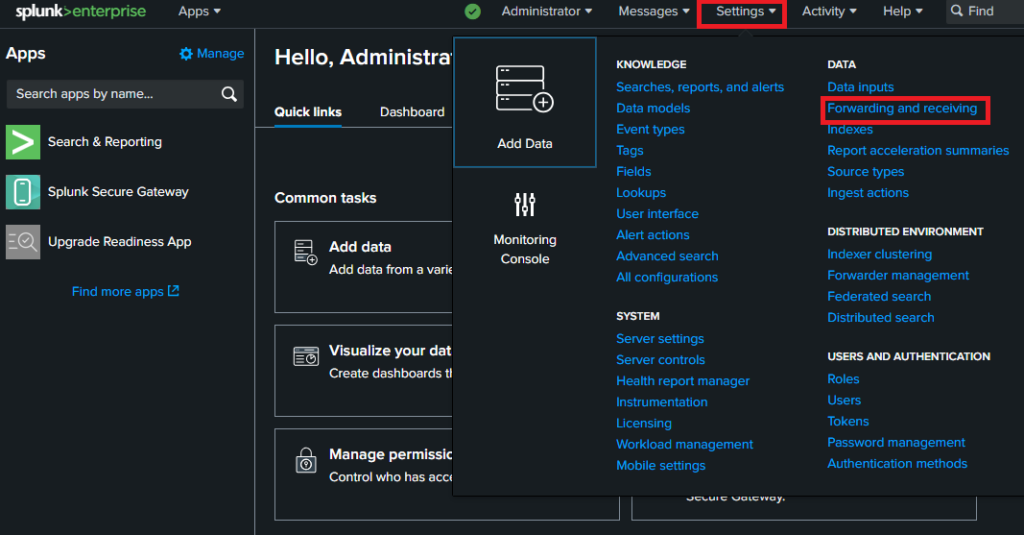
Once logged in, you’ll be greeted with the Splunk Dashboard. Navigate to Settings at the top of the page. Then click on “Forwarding and receiving”.
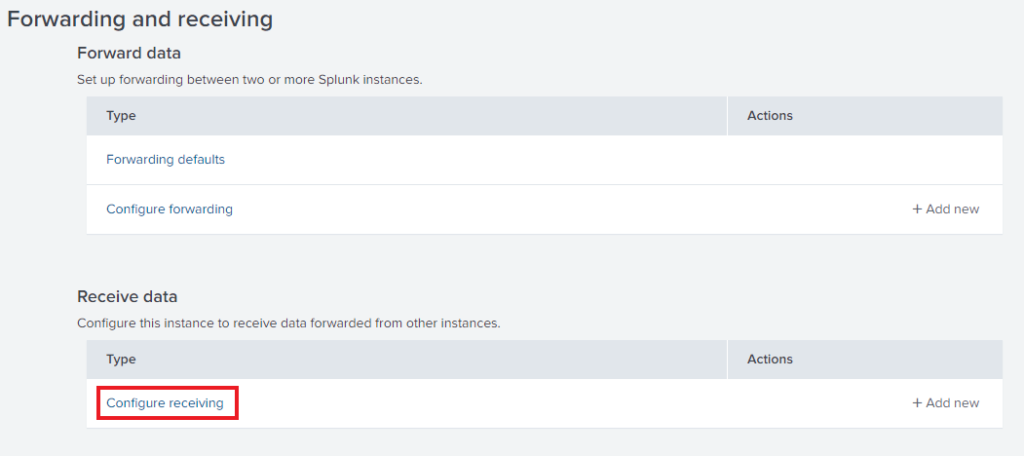
Then click on “Configure receiving” as shown below.
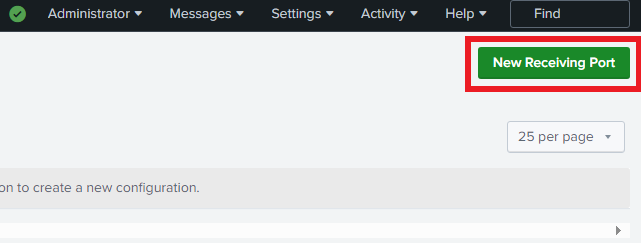
Click the Green button at the top right labeled “New Receiving Port”.
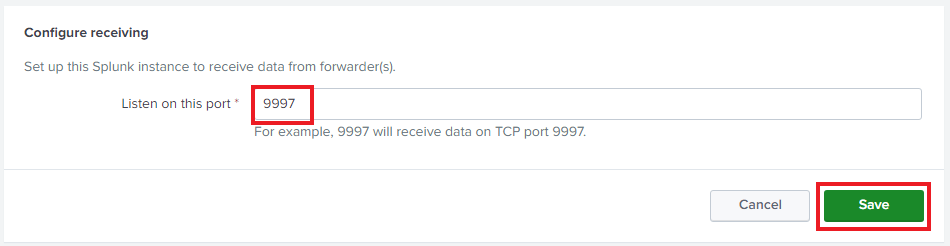
Plug in 9997. This is the default receiving port. Click save after.
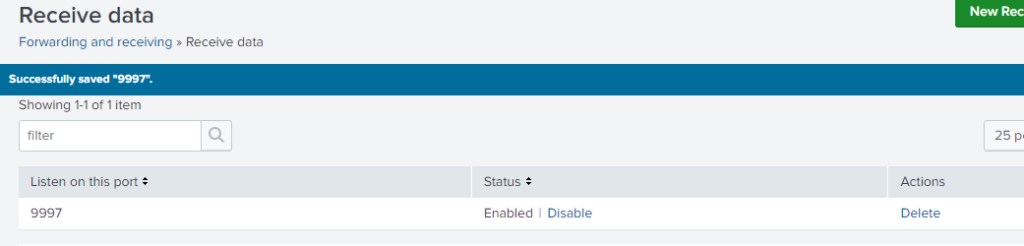
Once you click save, you will see the same as below.
After that, the Client1 Machine is set up. We can now switch over to the domain controller and deploy the Universal Forwarder.
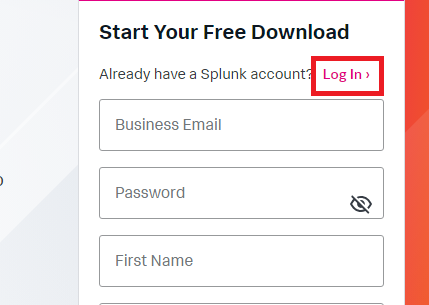
Open up a browser and search for “Splunk” just like last time. But this time, click the button under the Universal Forwarder.
You won’t have to enter your information again; just click Log In.
You may need to verify your email address; after that, try again, and it should let you access the downloads page.
For the Domain Controller, click on the Windows 64-bit Download button.
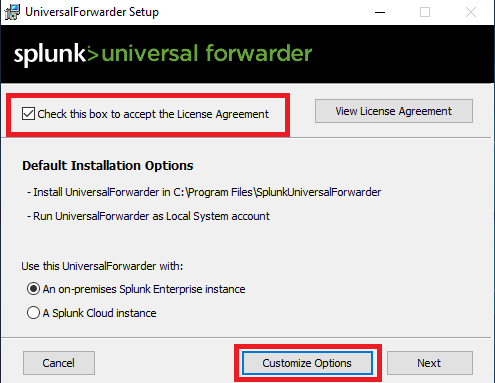
Accept the Agreements at the bottom of the next page. Then open the file once the download is complete. The Forwarder setup window will appear.
Check the box to accept the License Agreement, then click on the “Customize Option” Button.
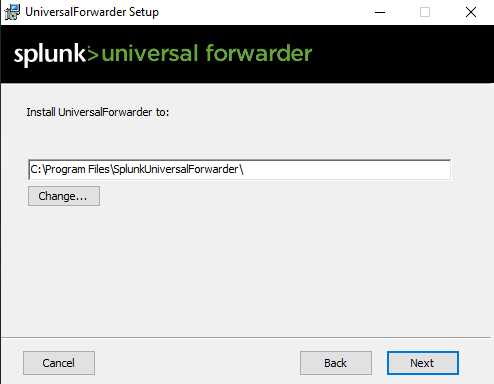
Keep the default install path and click Next.
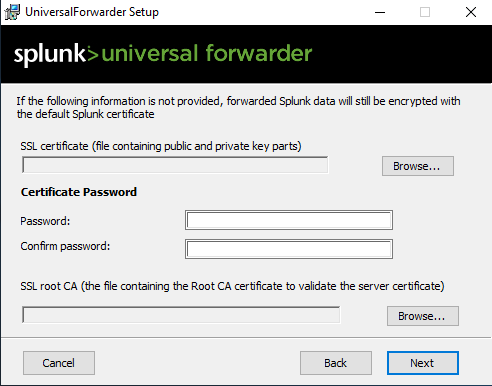
When it comes to the certificate information, leave it default.
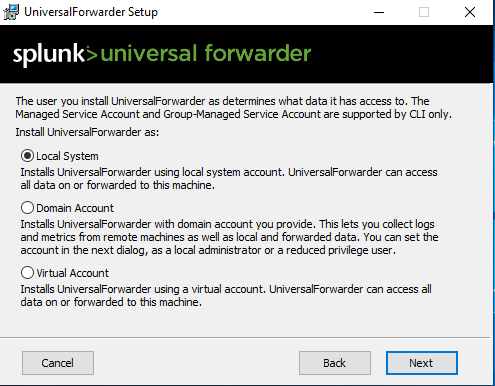
Leave the default local system authentication.
Check every box to monitor everything, then click the “Directory” button and select “Local Disk (C:)”. Then click on OK.
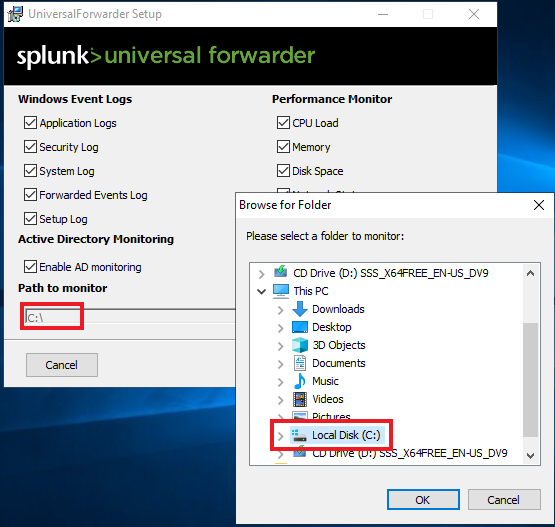
You should see the “Path to monitor” as “C:\”.
Click “Next” once done.
Then create a forwarder account. I used the name admin for this one.
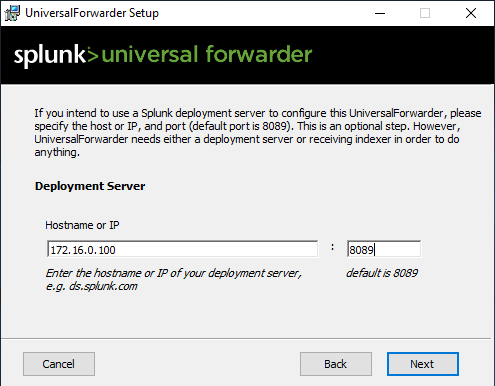
The next window will ask for the IP Address of the Deployment Server. In this case, this is Client1.
The IP address is 172.16.0.100 for Client1, it may be different for you. I will use the default port as shown below.
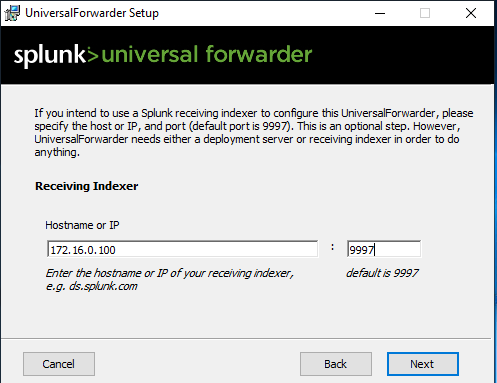
For the next step, enter Client1’s IP address, use the default port 9997, and click Next.
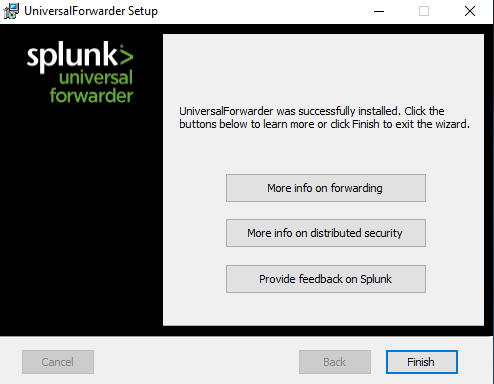
Then click install. Once finished, you’ll see the window shown below. Then you can just click finish.
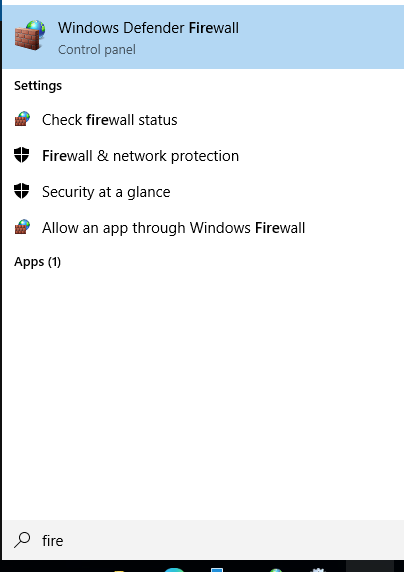
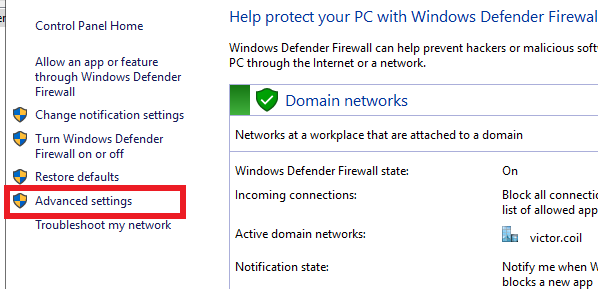
You must make firewall rules to allow the DC to send data to Windows 10. Search for “fire” and click on the first option.
Then click on advanced settings.
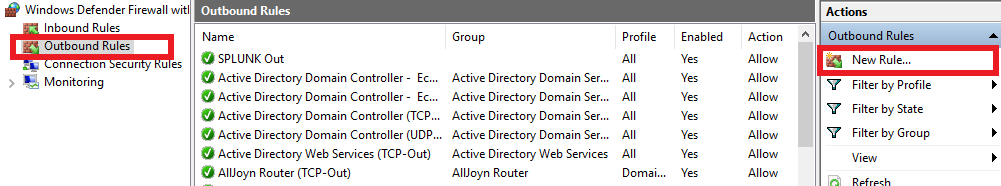
Make sure you are in the inbound rules, and on the right side, click New Rule.
Click on Port, then Next.
Leave as TCP
For the specific ports, put “8089, 9997, 389, 3268”, then click next.
Allow Connection, which should be the default. Click next
Leave Domain, private, and public checkmarked. Click next.
Then name it. I used “SPLUNK OUT”
Do the same thing on Windows 10, but do an inbound rule instead of an outbound rule.
After this, logs will start being sent from the DC to Windows 10. You may have to restart the Splunk Forwarder on the DC.
Integrating Sysmon
Sysmon for Enhanced Logging
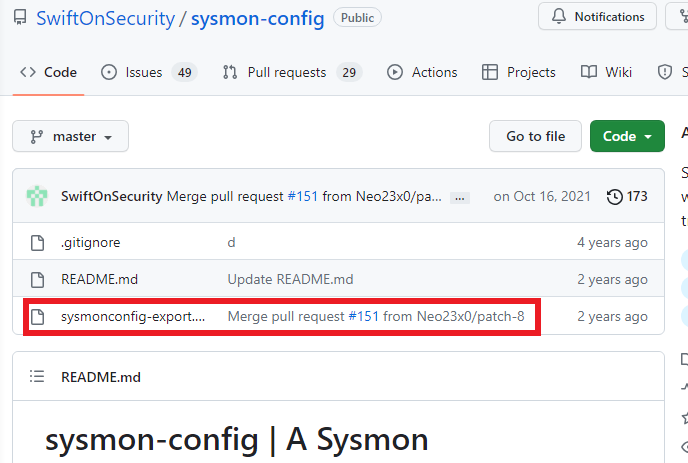
In your browser, search for “sysmon github” and click on the first link by swiftonsecurity. Inside GitHub, click the file shown below.
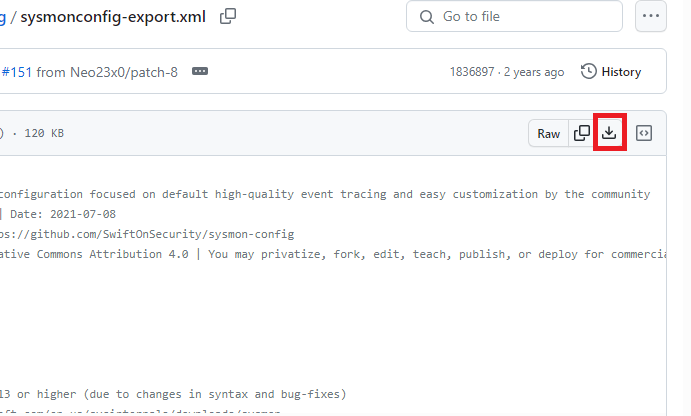
Click on the download button on the right side of the page.
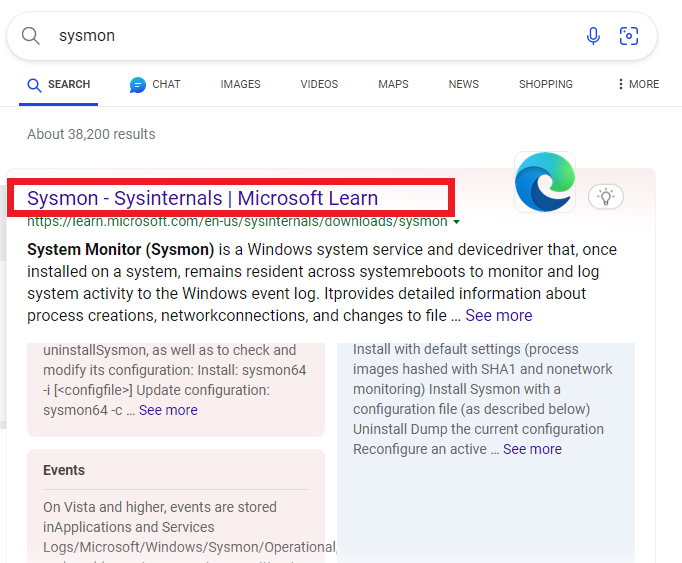
Search for just “Sysmon” and click on the top link.
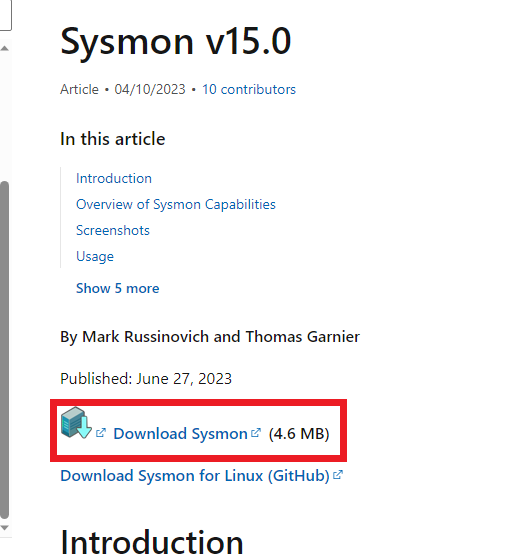
Then click on “Download Sysmon”.
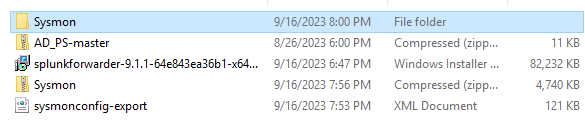
Once downloaded, open up your Download folder and extract the sysmon.zip. Once extracted, move the sysmoncong-export file into the Sysmon folder.
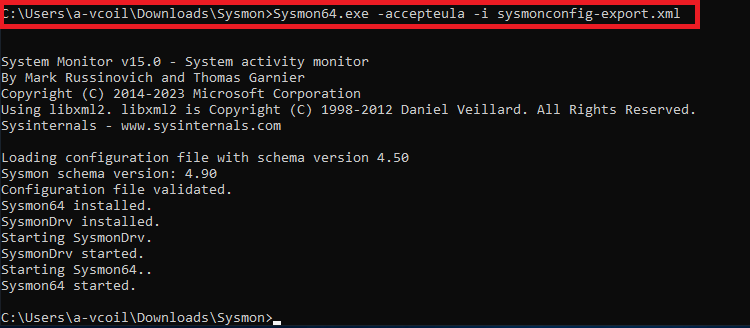
Then open the terminal as an administrator, navigate to the Sysmon folder inside the download folder, and run the command shown below.
If successful, it will produce the same output.
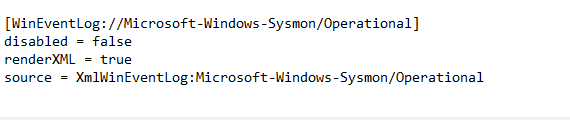
Now open up file explorer at the bottom, and navigate to “C:\program files\splunkuniversalforwarder\etc\apps\splunkuniversalforwarder\local\inputs.conf” and at the very bottom of the configuration file add the code shown below.
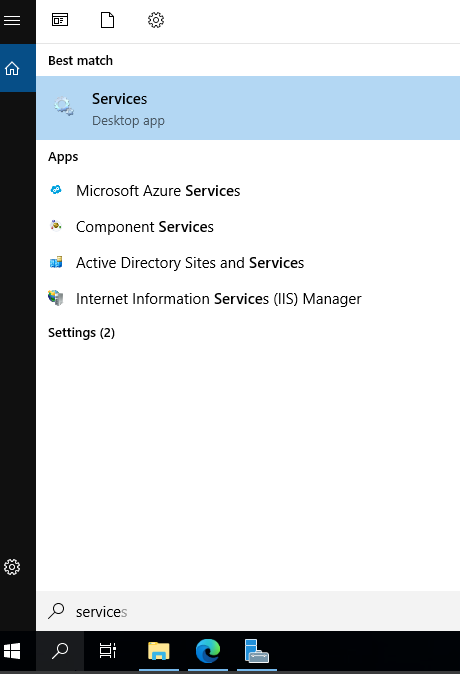
Close and save. Now search for services, as we have to restart the Splunk forwarder.
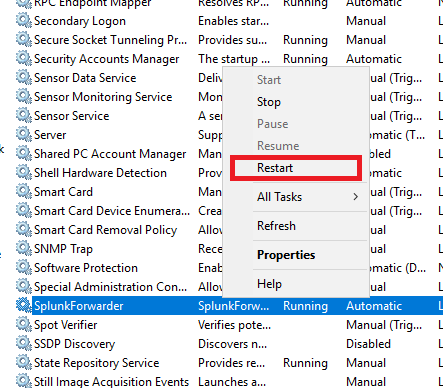
If the service stops after restarting and doesn’t restart, just start it again. (This happens if you open Services without Administrator Privileges)
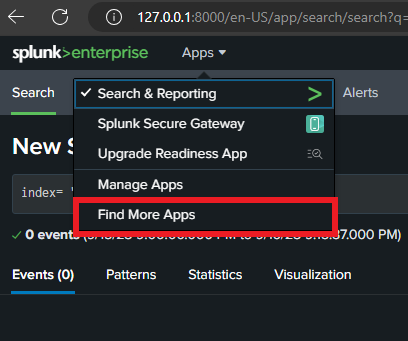
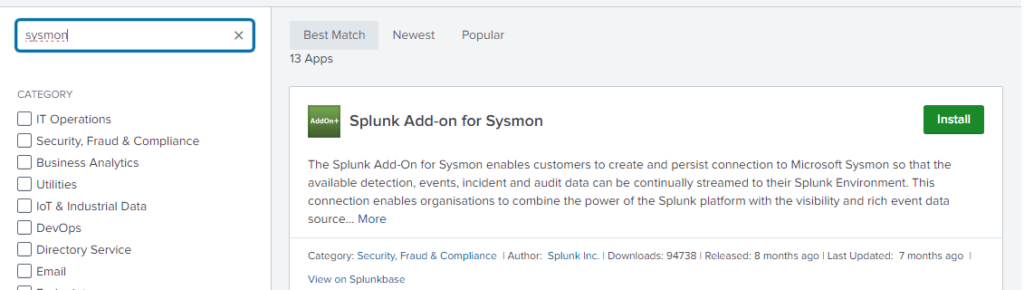
Back on the Splunk Web site. Click on Apps at the top and click on “Find More Apps”.
Then search for Sysmon and install the first option.
After installation, restart the forwarder.
So after all that.
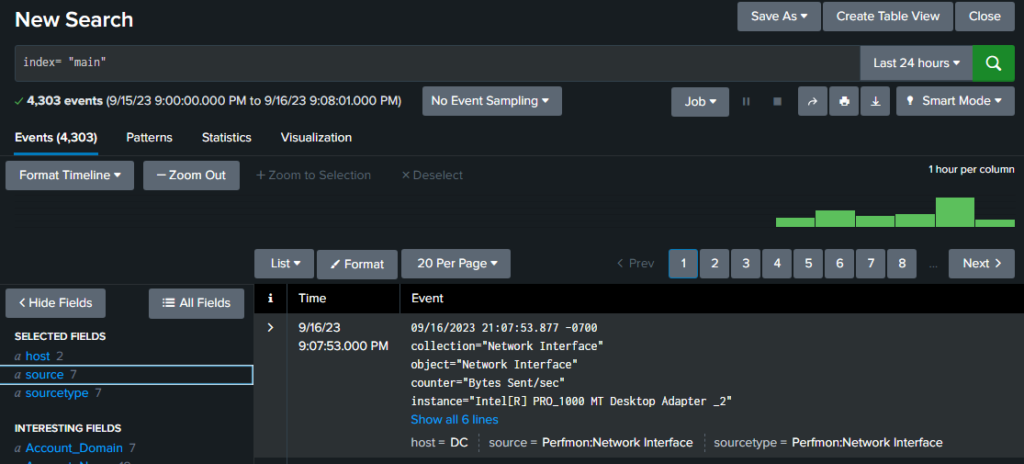
You can go to Windows 10 and test if you’re receiving the DC logs using the search query
Index = ‘main“
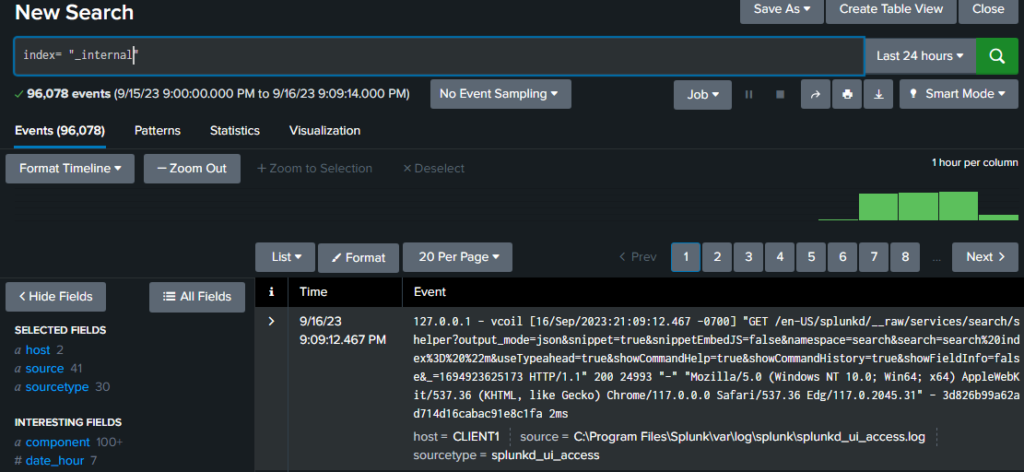
If you’re interested in the Windows 10 logs, you can do
Index = _internal
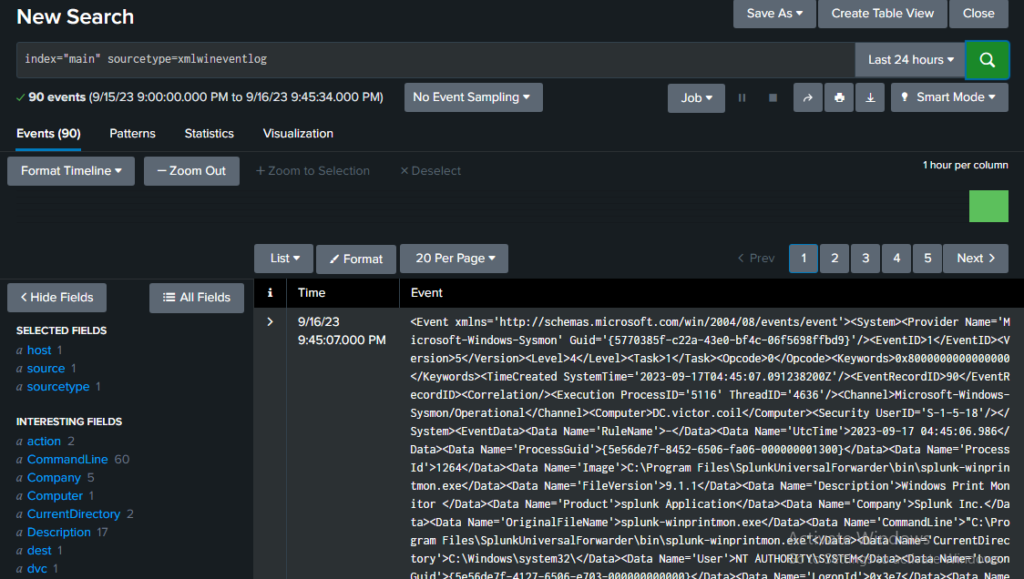
To search for the Sysmon logs specifically, you can search for
index=”main” sourcetype=xmlwineventlog
Deploying Snort
Integration of the Intrusion Detection System
We will now deploy Snort onto the domain controller.
Simply open up a browser inside the DC and search for Snort. Then click Downloads, as shown below.
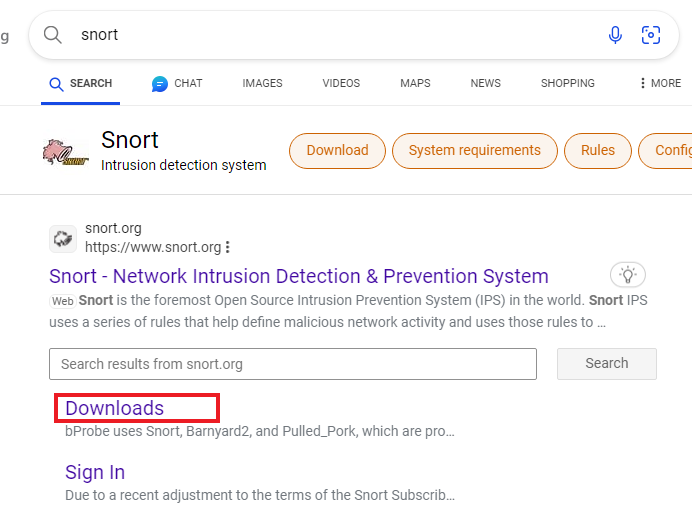
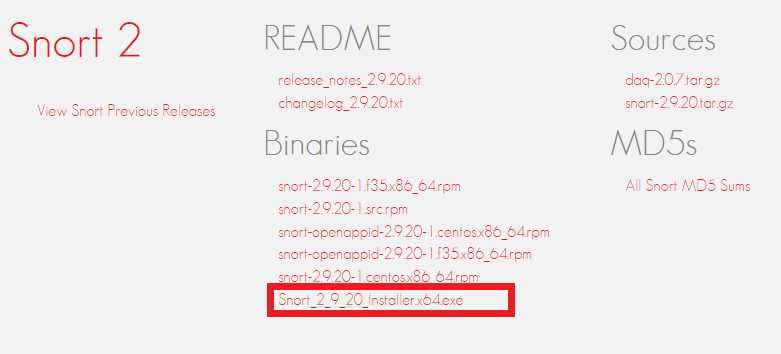
Once there, scroll down to the Snort 2 section and click on the .exe file to download Snort.
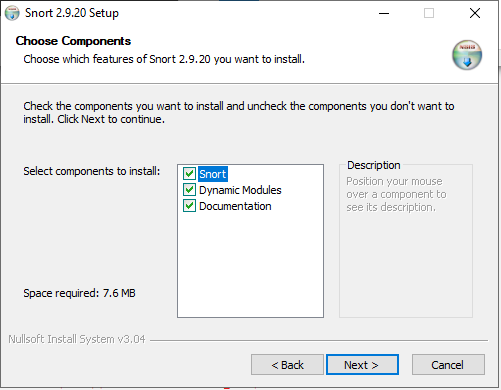
Open the downloaded .exe, and it will launch the setup wizard. Agree to the license agreement.
Leave all three components checked and click “Next”.
Leave the default path and click “Next”.
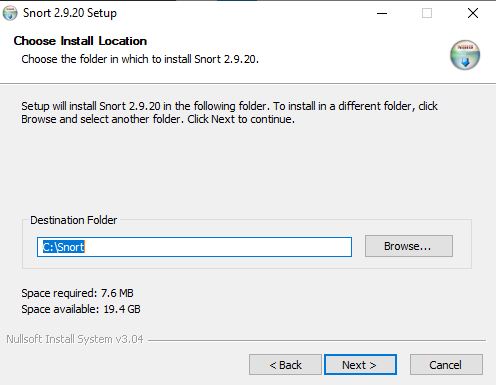
Once completed, click “Close”.
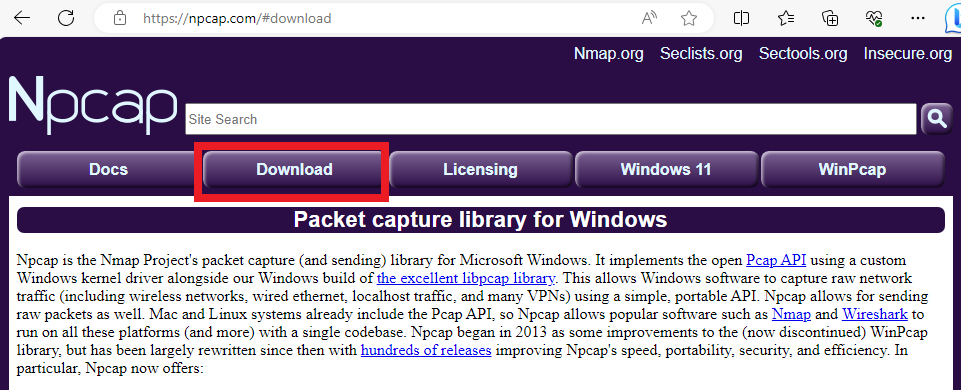
We haven’t installed Npcap, so we’ll download it next. They give you the URL to get it, so let’s navigate to it.

Once at the site, click on “Download”.
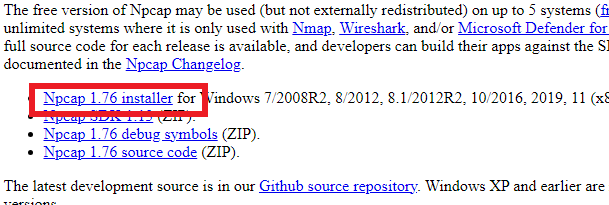
Then click on the first link as shown below.
Click the downloaded .exe, then agree to the license agreement when the wizard pops up.
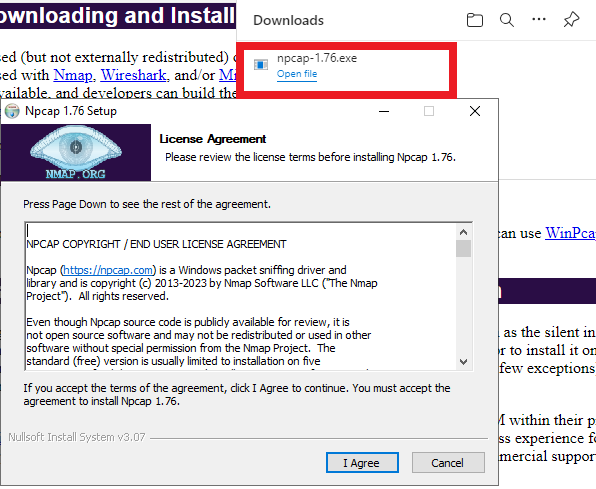
Leave the defaults and click on install. Once installed, click on Next and finish.
I won’t dive deep into the rules here, but if you want to set up rules.
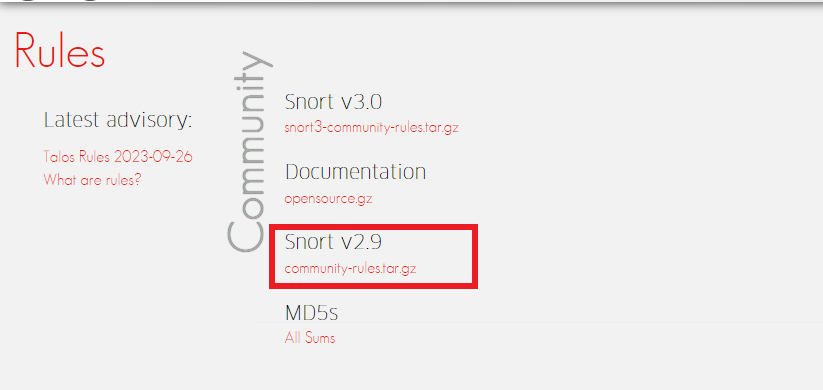
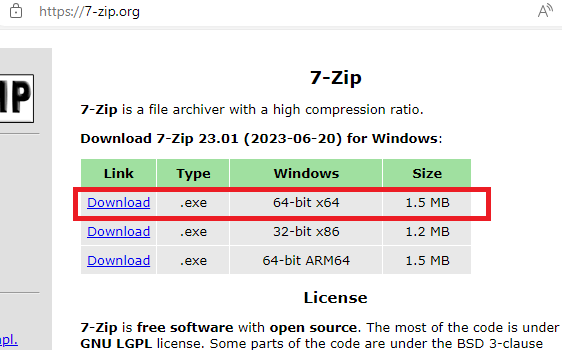
Go back to the Snort download page, and there will also be a “Rules” section. Download the V2.9 Community Rules. You’ll need a tool to open the archived files.
There are community rules where you can easily download, registered rules where you need an account to download, and subscription rules where you will have to pay for more.
I simply searched for 7-Zip and downloaded the version shown below.
Open up the archived folder, and place the community. rules file inside the C:\Snort\Rules folder
Let’s go and manually change the Snort config file.
Open up the file explorer, click on “This PC”, then double-click on the Local Disk (C:).
Navigate to Snort→ etc→ snort.
You may need to change the file permissions to make changes.
Right-click the file and select properties. Then click the Security tab and click Edit. You can click on “Full control” to allow write and modify permissions. Once changed, click Apply, click OK, and open the file.
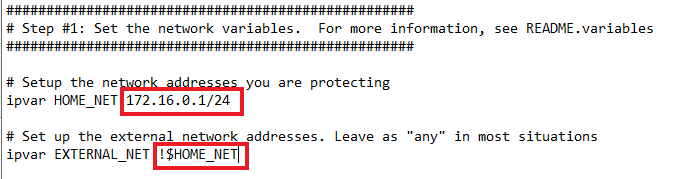
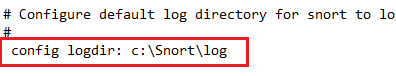
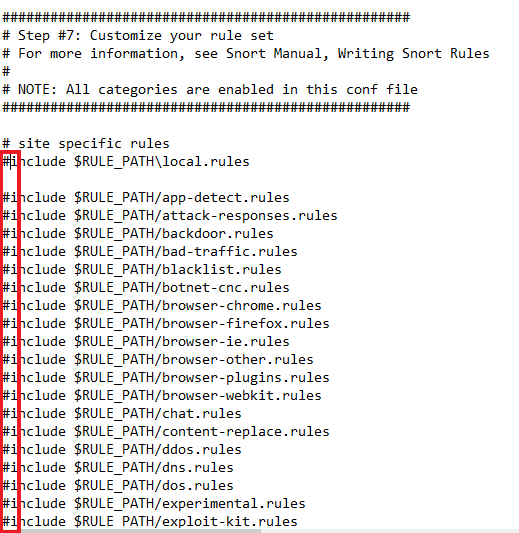
Once open, go to lines 45 and 48 and replace “any” with the Network IP that we are defending. As well as anything that is considered “external”. I just used the “!” or NOT operator, so any IP address that is not 172.16.0.1/24 is considered external.
Replace lines 104 and 106 with what’s shown below. Comment out line 105.
Replace lines 113 and 114 with the following content.
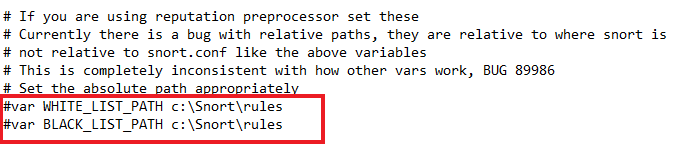
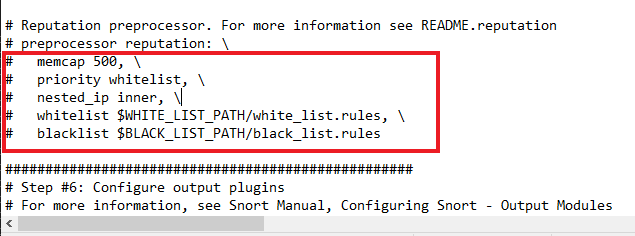
These are the paths to our blacklists and whitelists. For now, we can comment these out. But if you were to bring in the other registered rules, you may need to uncomment these lines.
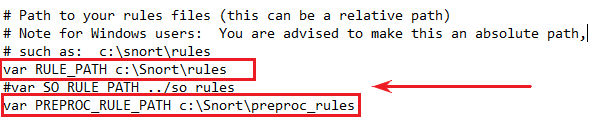
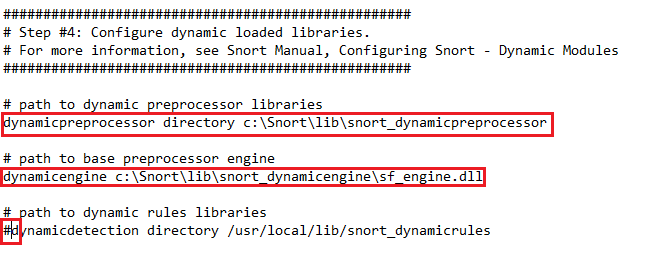
Uncomment Line 186 and place the directory path shown below.
Replace Lines 247 and 250 with the directory paths shown below. Then comment out line 253.
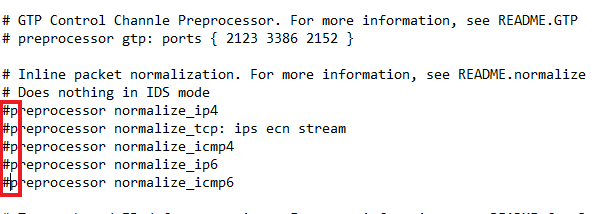
Comment out 265 to 269 as shown below.
Uncomment line 418 to allow portscan detection. Also, make the additional changes shown below.

Comment out lines 507 to 512.
I commented out lines 546 to 651. Future projects will dive deeper into Snort rules.
If you plan to use the other rules, make sure to update the rule paths.
Uncomment 659 to 661 and swap the forward slashes to backward slashes.
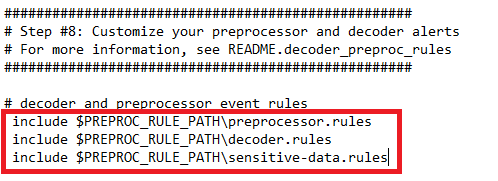
After that, save and close the file.
Open up the terminal and cd to “Snort\bin” and run “snort -w”. An error may appear that a vdruntime140.dll isn’t installed. If so, do the following. Otherwise, continue on.
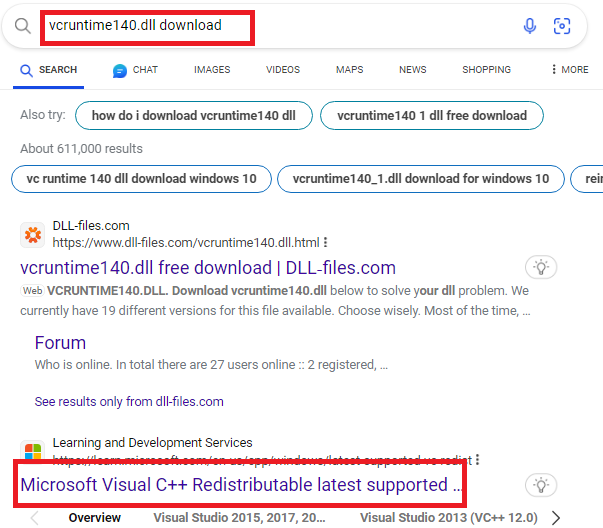
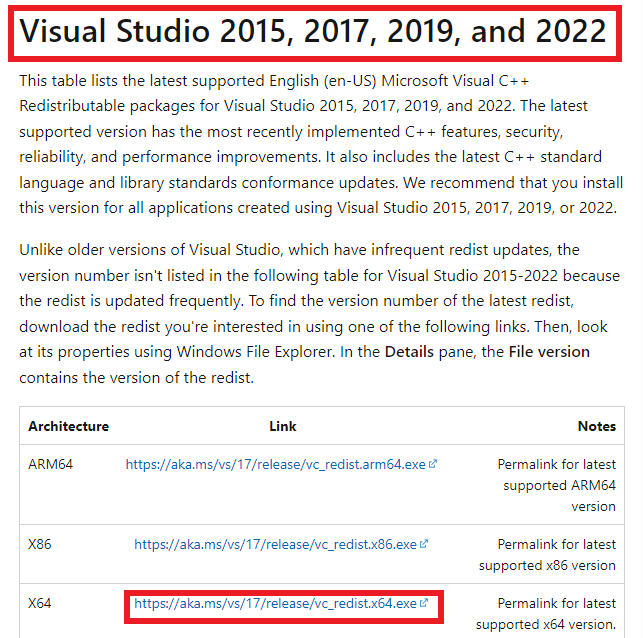
Scroll down until you see the below. Download the X64 version.
Run the downloaded .exe file.
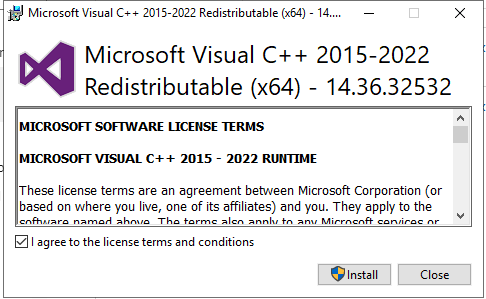
Agree to the license agreement, then click install. Once done, click close.
Open the terminal and run snort -w again. Take note of the interface with the network we are working with. For me, it is interface 5. It may be different for you.
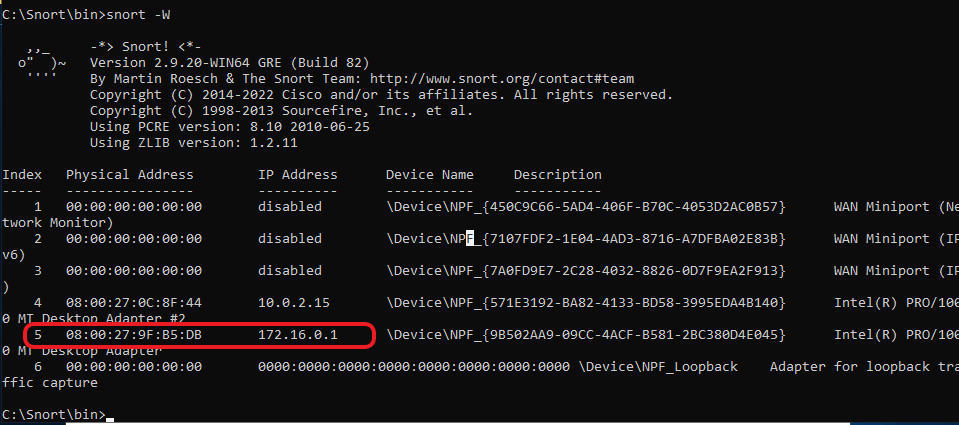
Then run snort -i 5 -c c:\Snort\etc\snort.conf -T
Replace the “5” with the interface that you will be using.
Once ran you will see the content below.
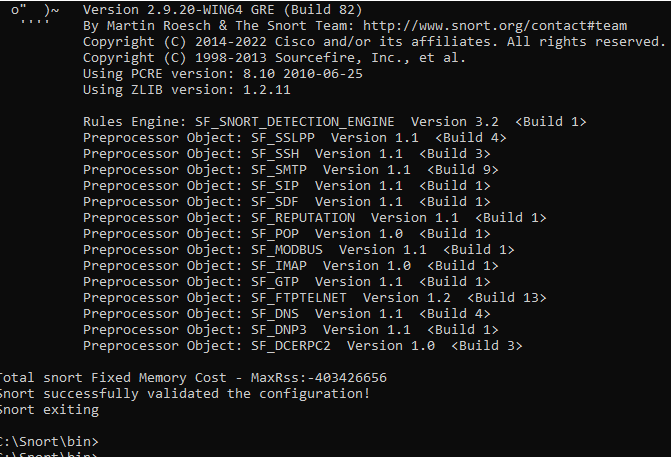
So the Snorts configuration file is running successfully, which is great. Let’s just make some small changes to make the logs more readable.
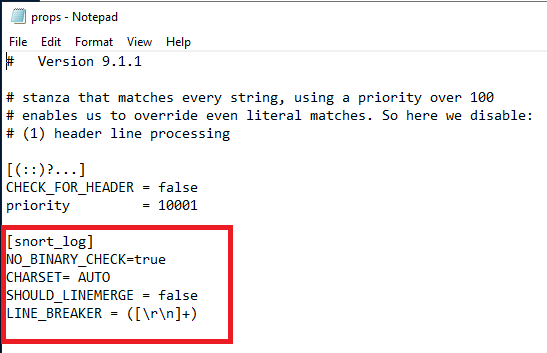
On the DC VM, navigate to Program Files\SDplunkUniversalForwarder\etc\apps\SplunkUniversalForwarder\default\props.conf
In this file, add the content shown below.
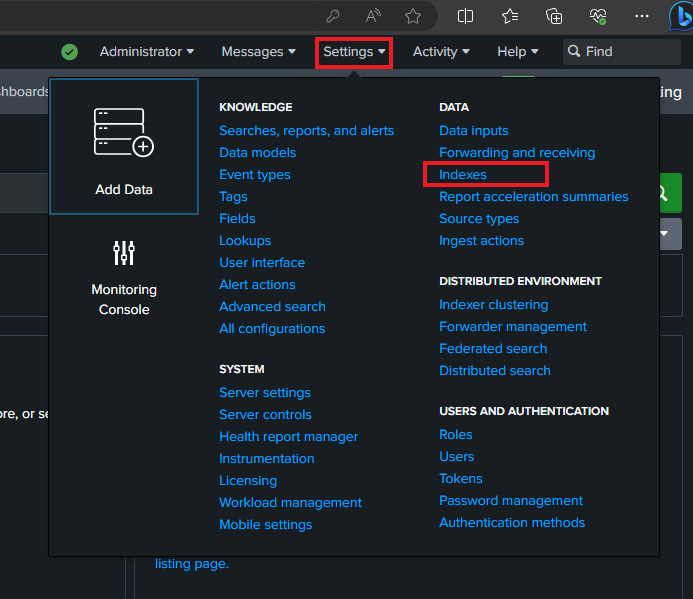
Navigate back to Client1 and in the Splunk UI, go to settings, then indexes
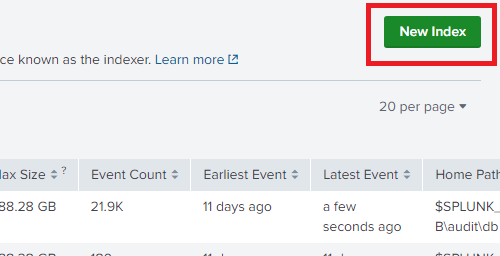
Click on the new index.
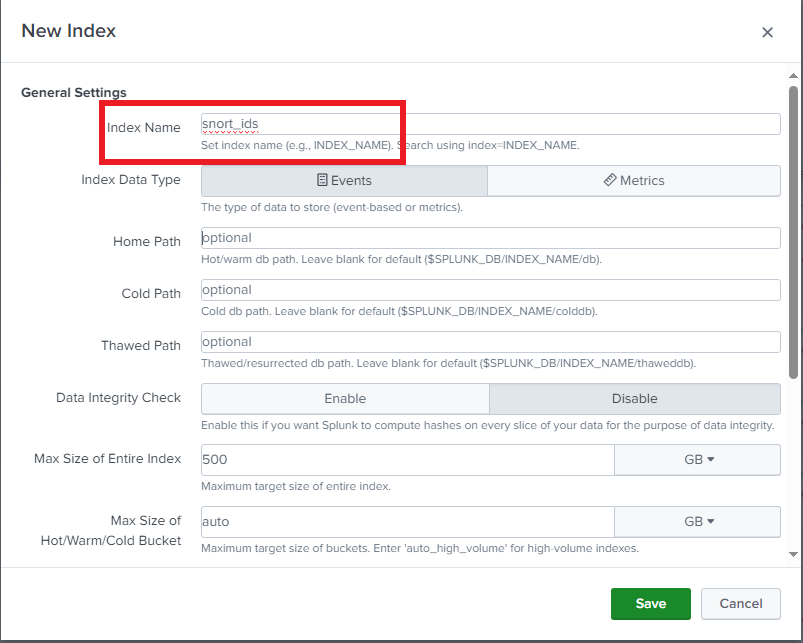
Name it snort_ids, then save the index.
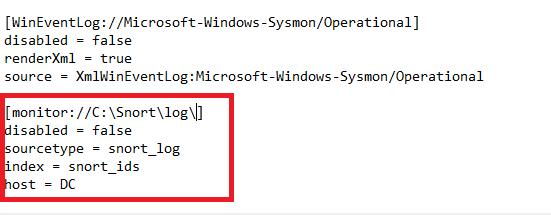
BACK in the DC, navigate to c:\Program Files\SplunkUniversalForwarder\etc\apps\SplunkUniversalForwarder\Local and open the input.confs file again.
Put the content shown below. Right below the sysmon stuff we added earlier.
Then restart the SplunkUniversal Forwarder service. You may have to turn it off and then turn it on.
Because we commented out most of the rules, Snort isn’t very noisy. But we still have the rule that can detect port scans. Additional 3-way handshakes may also get picked up by Snort.
We should be good to run Snort now. Run the command below
Use snort -A console -i 5 -c c:\snort\etc\snort.conf -K ascii
If you want it to run in the background, do this command: snort -D -i 5 -c c:\snort\etc\snort.conf -K ascii
Showcase
Showcasing a bit of Sysmon and SNort
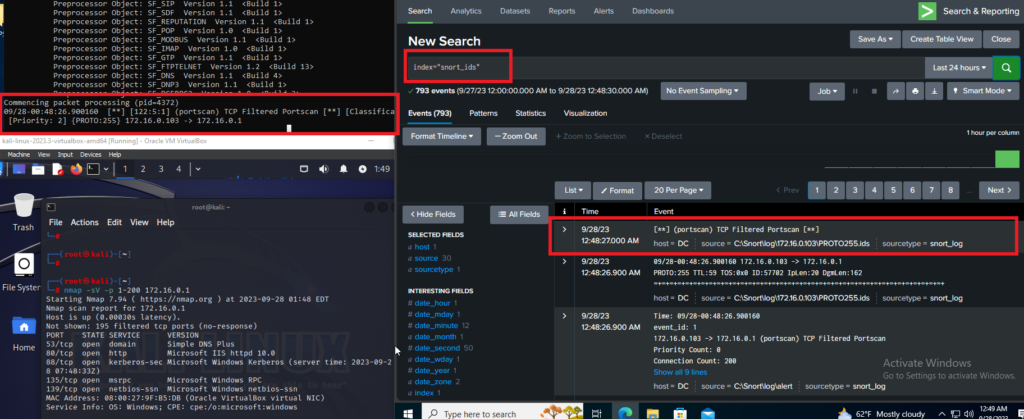
I brought a Kali machine into the environment and performed an NMAP scan.
A bit of a wide picture, but this shows Snort running on the DC and picking up an NMAP scan. The log is also being pushed into Splunk with the rest of the logs.
So, a bit of a showcase on why we integrated Sysmon.
Multiple Sysmon events can help detect threat actors’ movements. Here are some notable ones
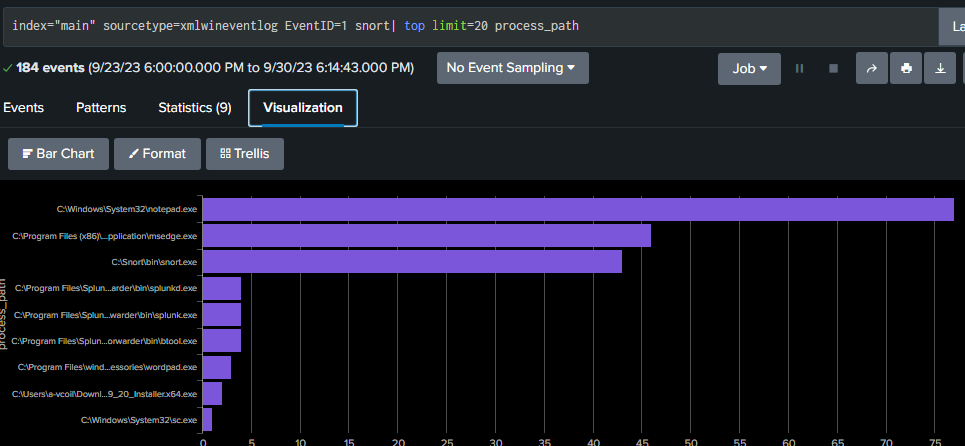
Event ID 1 – Process Creation
The image below shows any process creations that contained the word “snort”. When doing things like this, it’s better to look at the rare items.
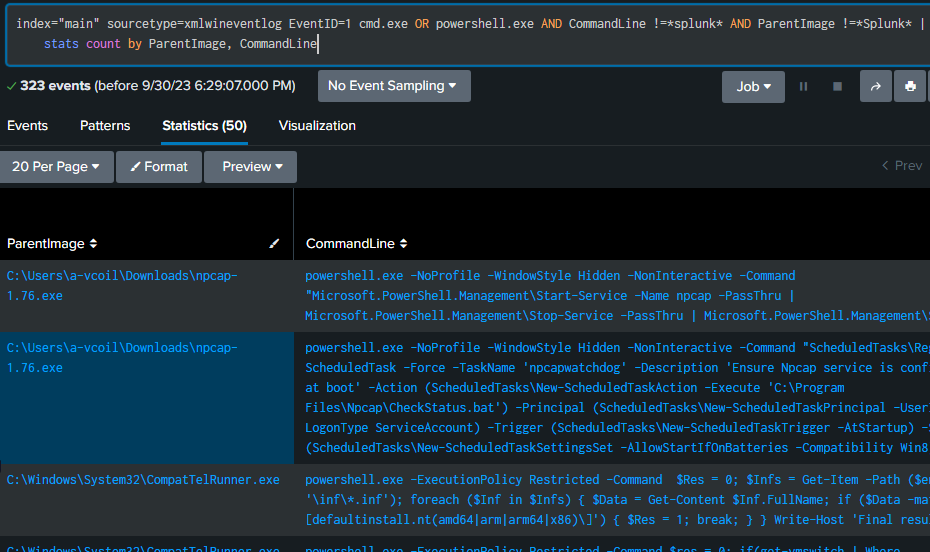
The command below will show if any cmd.exe or PowerShell commands were run.
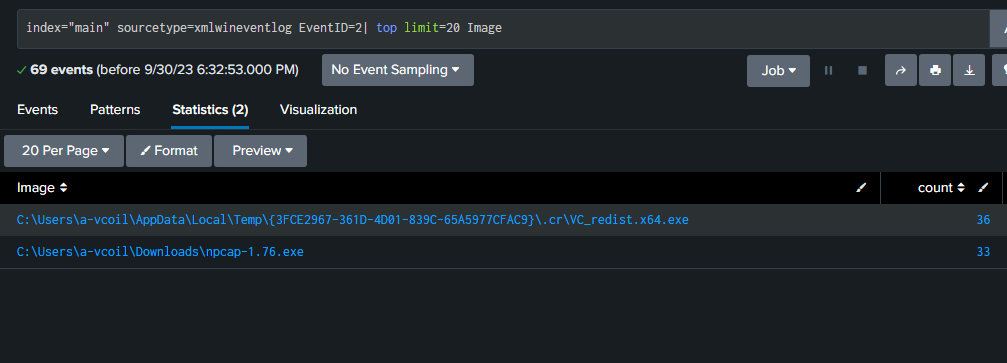
Event ID 2 – Process changed time
The why for this one is if a threat actor is trying to scramble the trail they’re leaving behind. These can help detect defense evasion.
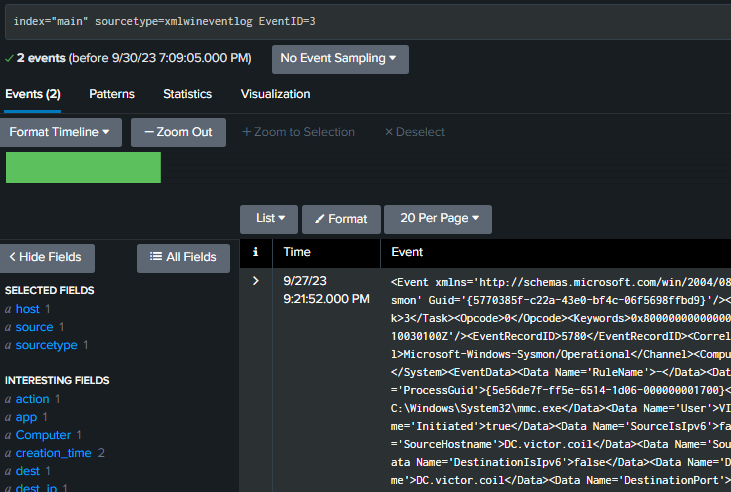
Event ID 3 – Network Connection
In this environment, it wasn’t very noisy, though it can help in the real world. It can detect high network traffic. You would have to filter by source IP.
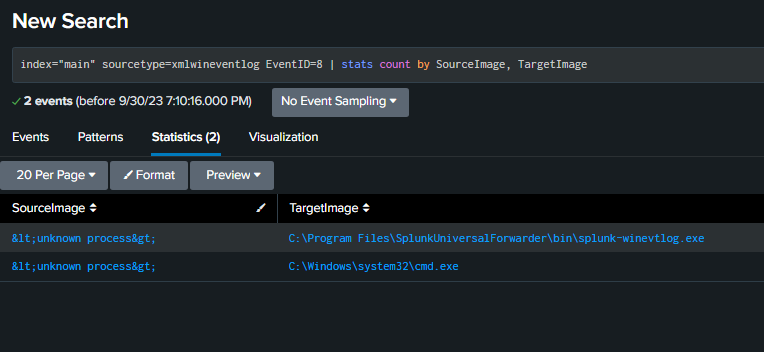
Event ID 8 – Creating Remote Thread
This one is when a process creates a thread under another process.
The following will help detect any processes trying to steal from other processes.
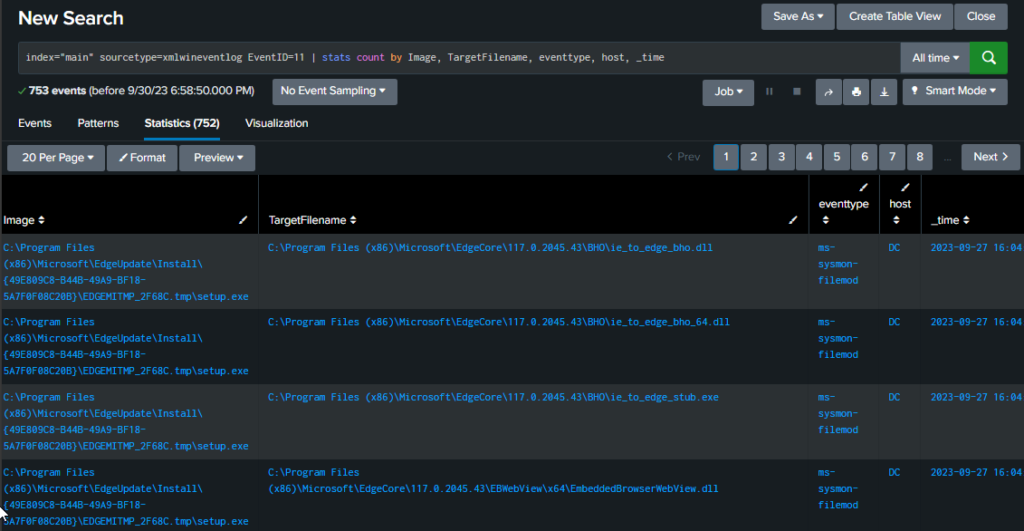
Event ID 11 – File creation or overwritten
The command below will show the path, the target file, whether it’s being modified or created, the host, and the time of change/creation.
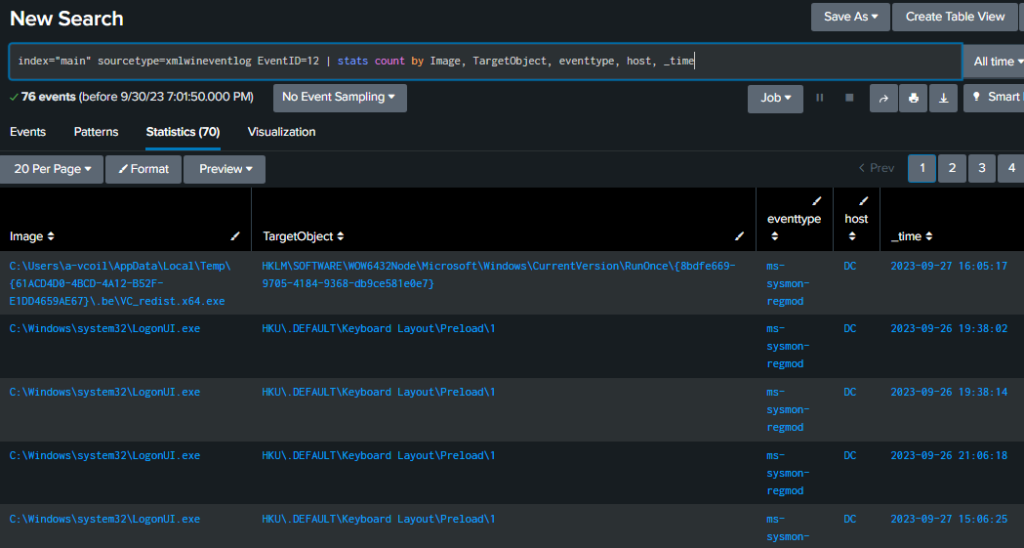
Event ID 12 – Registry Key Object Create and Delete
The command below will detect any registry key being created or deleted.
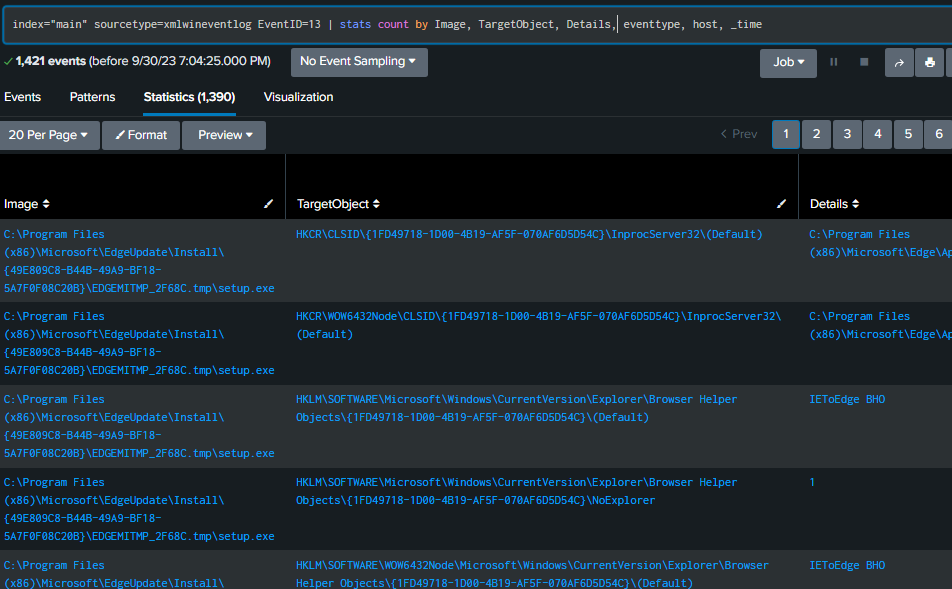
Event ID 13 – Registry Value Set
This Event ID will show the values that are set for a registry key
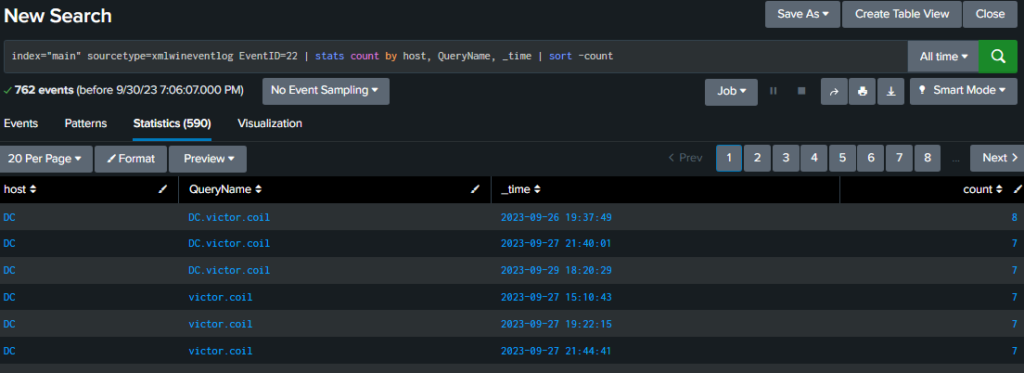
Event ID 22 – DNS Event
The command below will show any DNS events occurring
So what have we done…
– Deployed Splunk Enterprise (SIEM) for Centralized logging
– Enhanced logging using Sysmon
– Deployed Snort Intrusion Detection System (IDS) into the environment
– Forwarded All Logs, including Snort Logs, using Universal Forwarders
This concludes the lab.